[Dashboard] memory leak, some jQuery Object, Promise objects cannot be GC after refresh #8455
Labels
bug
Fixes for quality problems that affect the customer experience
Feature:Dashboard
Dashboard related features
Comments
|
+1, the same issue regardless of auto-refresh. |
|
The same version of the problem |
|
+1 Any progress on this? |
|
+1 this is still happening on 5.2 |
|
I can confirm the memory leakage problem in chrome with Kibana 5.4.1 |
|
It`s the same issue: #7427 |
|
Closing as a duplicate of #7427. I know this issue was created earlier but that one has more comments in it. |
Sign up for free
to join this conversation on GitHub.
Already have an account?
Sign in to comment
Kibana version:kibana-5.0.0-alpha5-linux-x86_64
Elasticsearch version:elasticsearch-5.0.0-alpha5
Server OS version:Ubuntu 14.04.5 LTS
Browser version:Version 53.0.2785.116 (64-bit)
Browser OS version:Ubuntu 14.04.5 LTS
Original install method (e.g. download page, yum, from source, etc.):dowload tar files from https://www.elastic.co
Description of the problem including expected versus actual behavior:
Expect: Newly created Objects should be GC after the next refresh;
Actual: After each refresh, there are still some objects have not been GC. This lead to memory usage keep growing.Chrome Tab will crash when keeping dashboard auto refresh;
Steps to reproduce:
1.open chrome in incognito mode
2.create a new dashboard, add a visualization
3.open chrome devtools, goto devtools's profile panel, start Record Allocation Timeline
4.set auto refresh interval to 5s, enable autorefresh
5.observing Allocation Timeline
Errors in browser console (if relevant):
Provide logs and/or server output (if relevant):
Recorded Profile:Heap-20160923T155153.heaptimeline
Constructor list: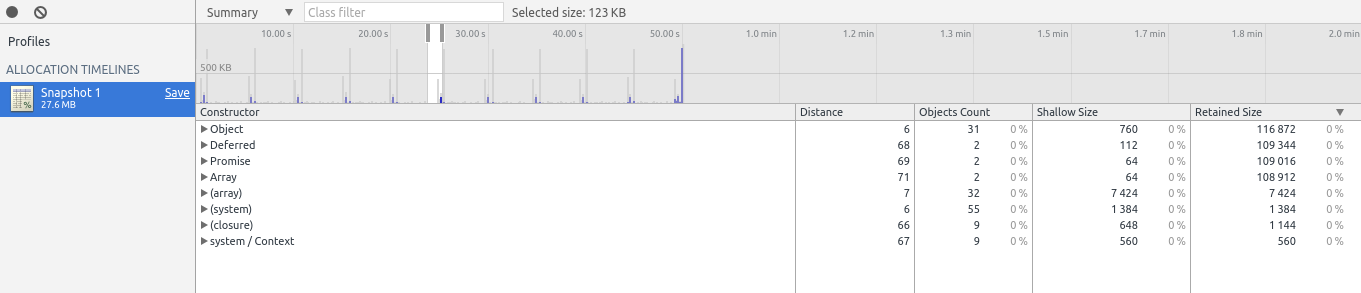
A Object: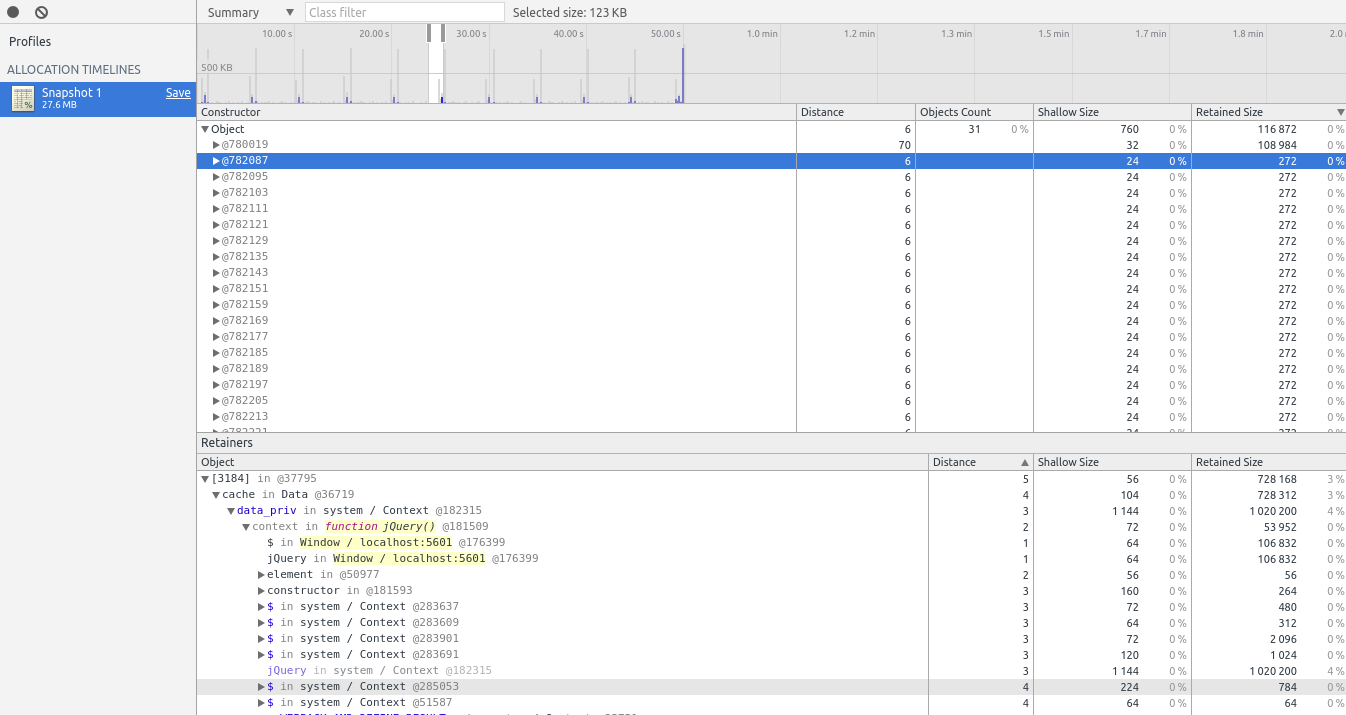
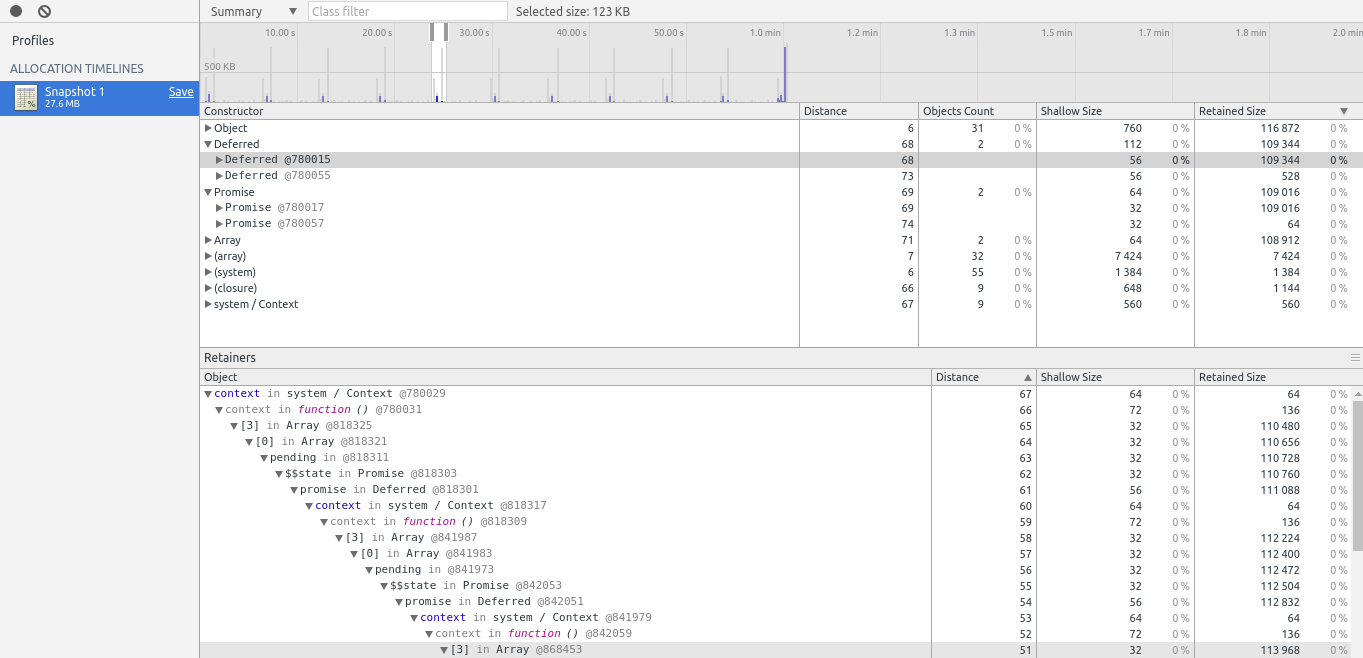
A Deferred Object:
I also tested the following kibana versions, this issue still exists.
Tested kibana versions:
kibana_4.1.11
kibana_4.2.2
kibana_4.5.4
kibana_4.6.1
The text was updated successfully, but these errors were encountered: