How can we know how many resources my training is using? #10186
Comments
|
@JesusSilvaUtrera 👋 Hello! Thanks for asking about CUDA memory issues. YOLOv5 🚀 can be trained on CPU, single-GPU, or multi-GPU. When training on GPU it is important to keep your batch-size small enough that you do not use all of your GPU memory, otherwise you will see a CUDA Out Of Memory (OOM) Error and your training will crash. You can observe your CUDA memory utilization using either the
CUDA Out of Memory SolutionsIf you encounter a CUDA OOM error, the steps you can take to reduce your memory usage are:
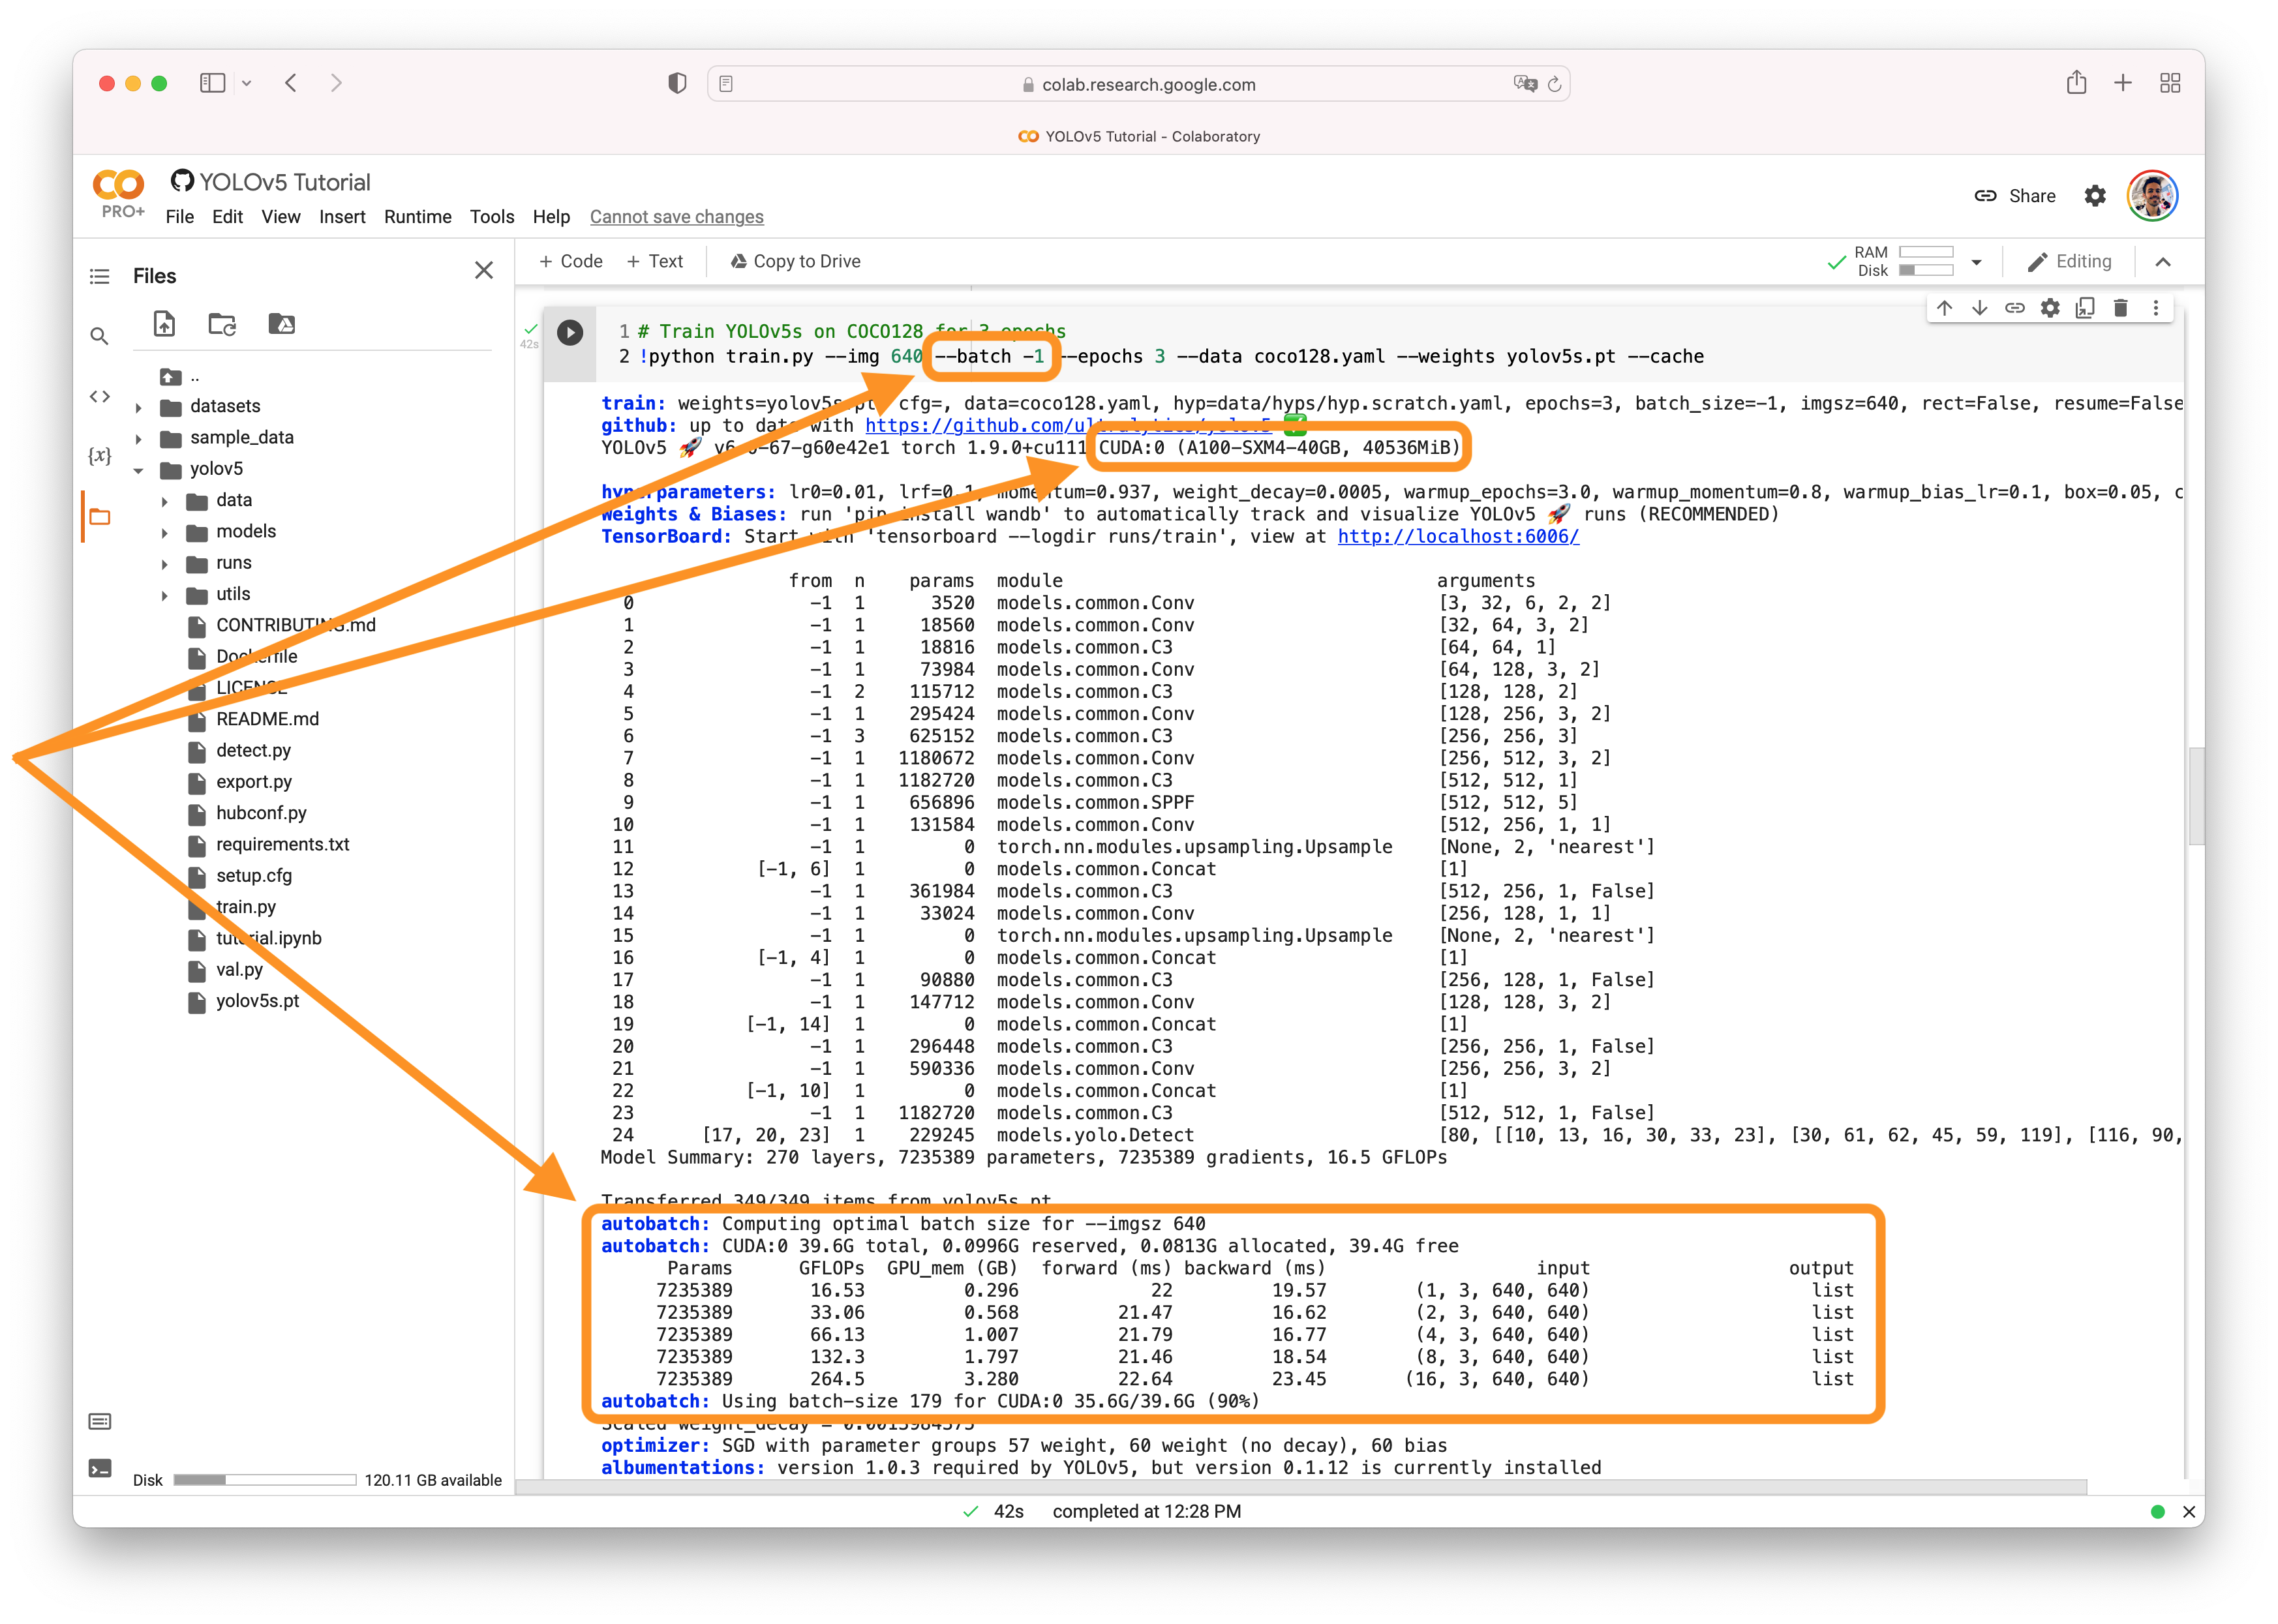
AutoBatchYou can use YOLOv5 AutoBatch (NEW) to find the best batch size for your training by passing
Good luck 🍀 and let us know if you have any other questions! |

|
For example, if I throw a training in local, it takes a lot more time than when I use docker compose for example, but in the docker compose if I use more than 100 images it exceeds the resources (I have 8 gb RAM dedicated to docker), whereas in my local I can throw a training with 200 images and it goes slow but doesn't show any error. i want to know why this happens and how to fix this, or at least know how many resources my training needs |
|
👋 Hello, this issue has been automatically marked as stale because it has not had recent activity. Please note it will be closed if no further activity occurs. Access additional YOLOv5 🚀 resources:
Access additional Ultralytics ⚡ resources:
Feel free to inform us of any other issues you discover or feature requests that come to mind in the future. Pull Requests (PRs) are also always welcomed! Thank you for your contributions to YOLOv5 🚀 and Vision AI ⭐! |
|
@JesusSilvaUtrera Great observations! The local training may be taking longer due to hardware acceleration differences or other system-specific factors. The Docker environment with 8GB of RAM dedicated may be insufficient for larger workloads, causing resource exhaustion during training. To determine your training's resource requirements, start with smaller batches and incrementally increase the batch size until you encounter resource limitations. Likewise, monitor GPU memory usage and adjust your batch size or image resolution to fit within your available resources. You can use system monitoring tools such as In the Docker environment, you might consider increasing the allocated memory to support larger workloads. Additionally, using resource limits, such as setting a memory limit with the Optimizing resource usage often involves a balance of batch size, image resolution, and available hardware. Feel free to reach out if you have further questions or need assistance! |
Search before asking
Question
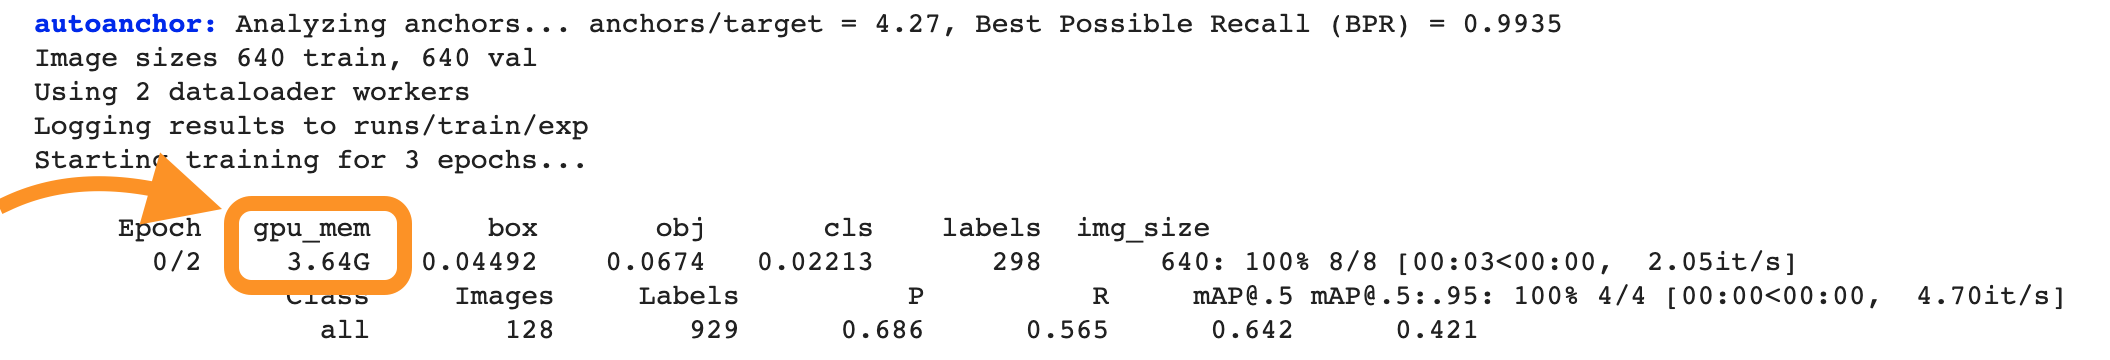
Hi, I wanted to know why the value of the gpu_mem increases with the passage of the epochs and it's not a constant (or almost constant) value, because every epoch has the same batch size and input size, so the memory usage should be the same, shouldn't it?
Also I wanted to know how can we know how many RAM memory is necessary for our training in case, for example, we want to deploy a service on a cluster to train models.
Thanks in advance.
Additional
No response
The text was updated successfully, but these errors were encountered: