Table of Contents
Performa is a multi-server monitoring system with a web based front-end UI. It can monitor CPU, memory, disk, network, and of course your own custom metrics. Alerts can be configured to trigger on any expression, and send e-mails or fire web hooks. Timeline data can be stored on local disk or in Amazon S3.
- Easy to install, configure and run
- Monitor any number of servers
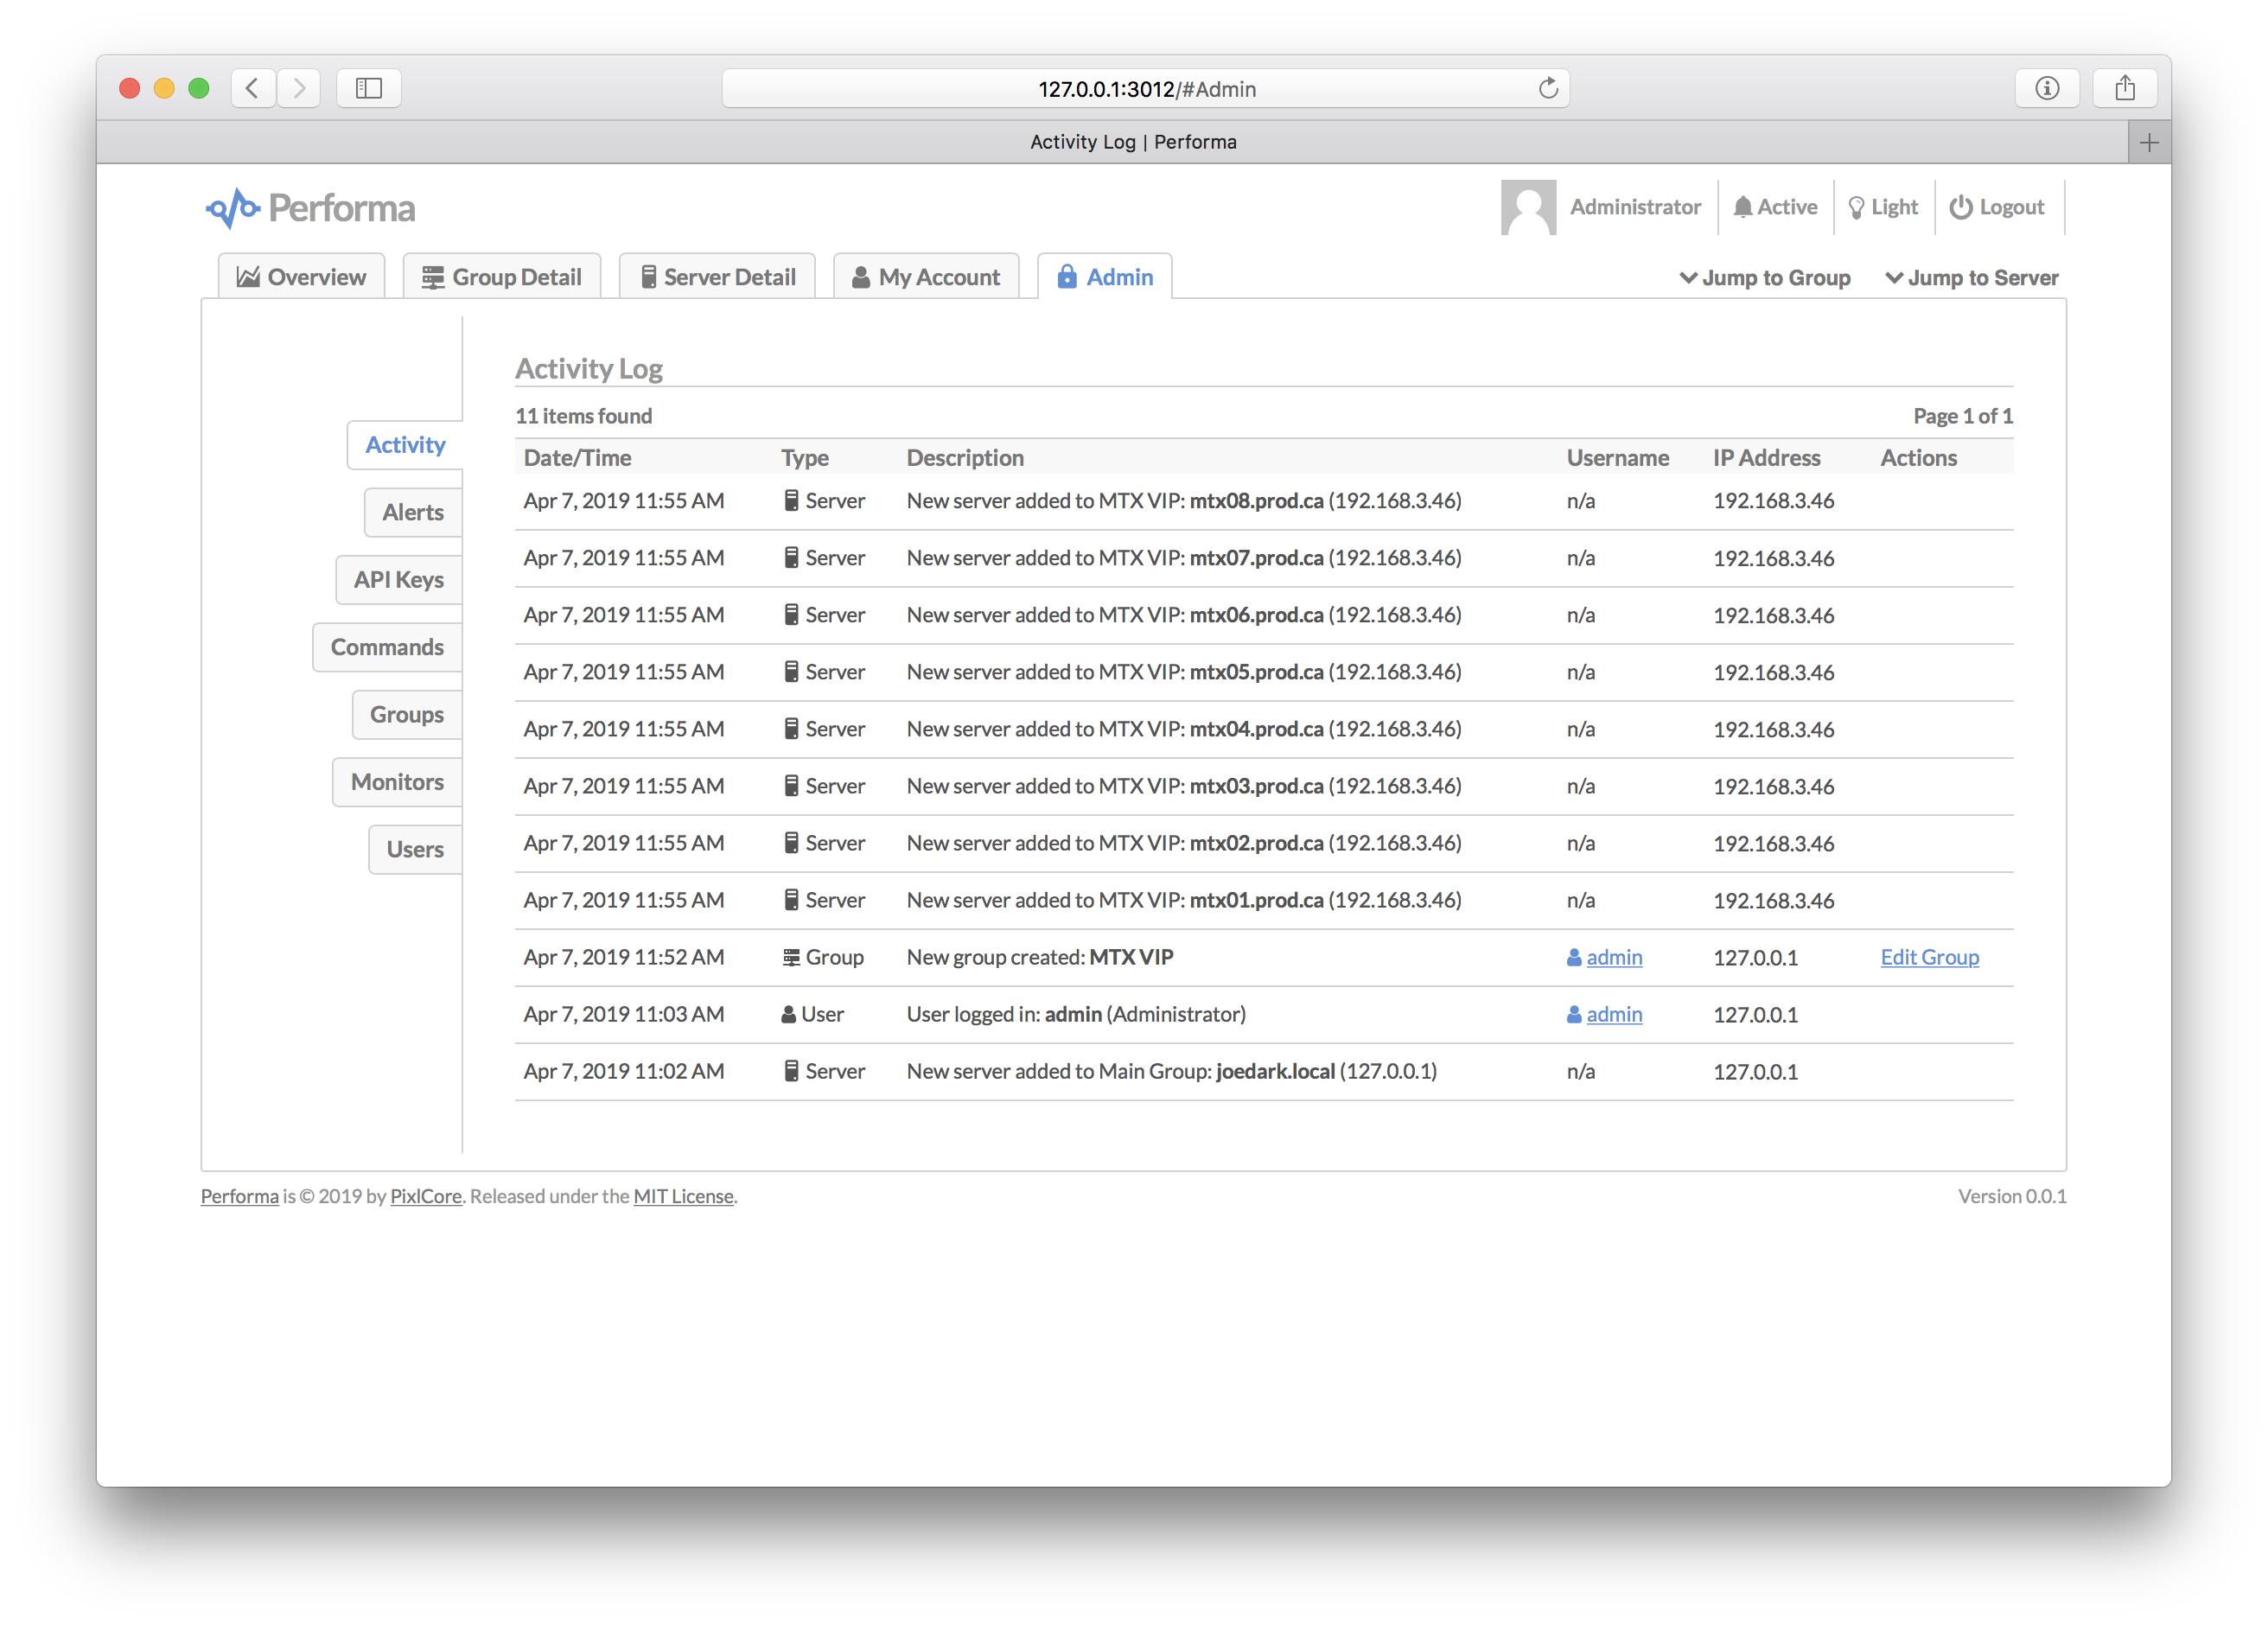
- New servers are added to the system automatically
- Assign servers to groups manually or automatically
- Supports ephemeral servers (serverless, autoscale, etc.)
- Metrics are collected every minute
- Multiple graph scales: hourly, daily, monthly, yearly
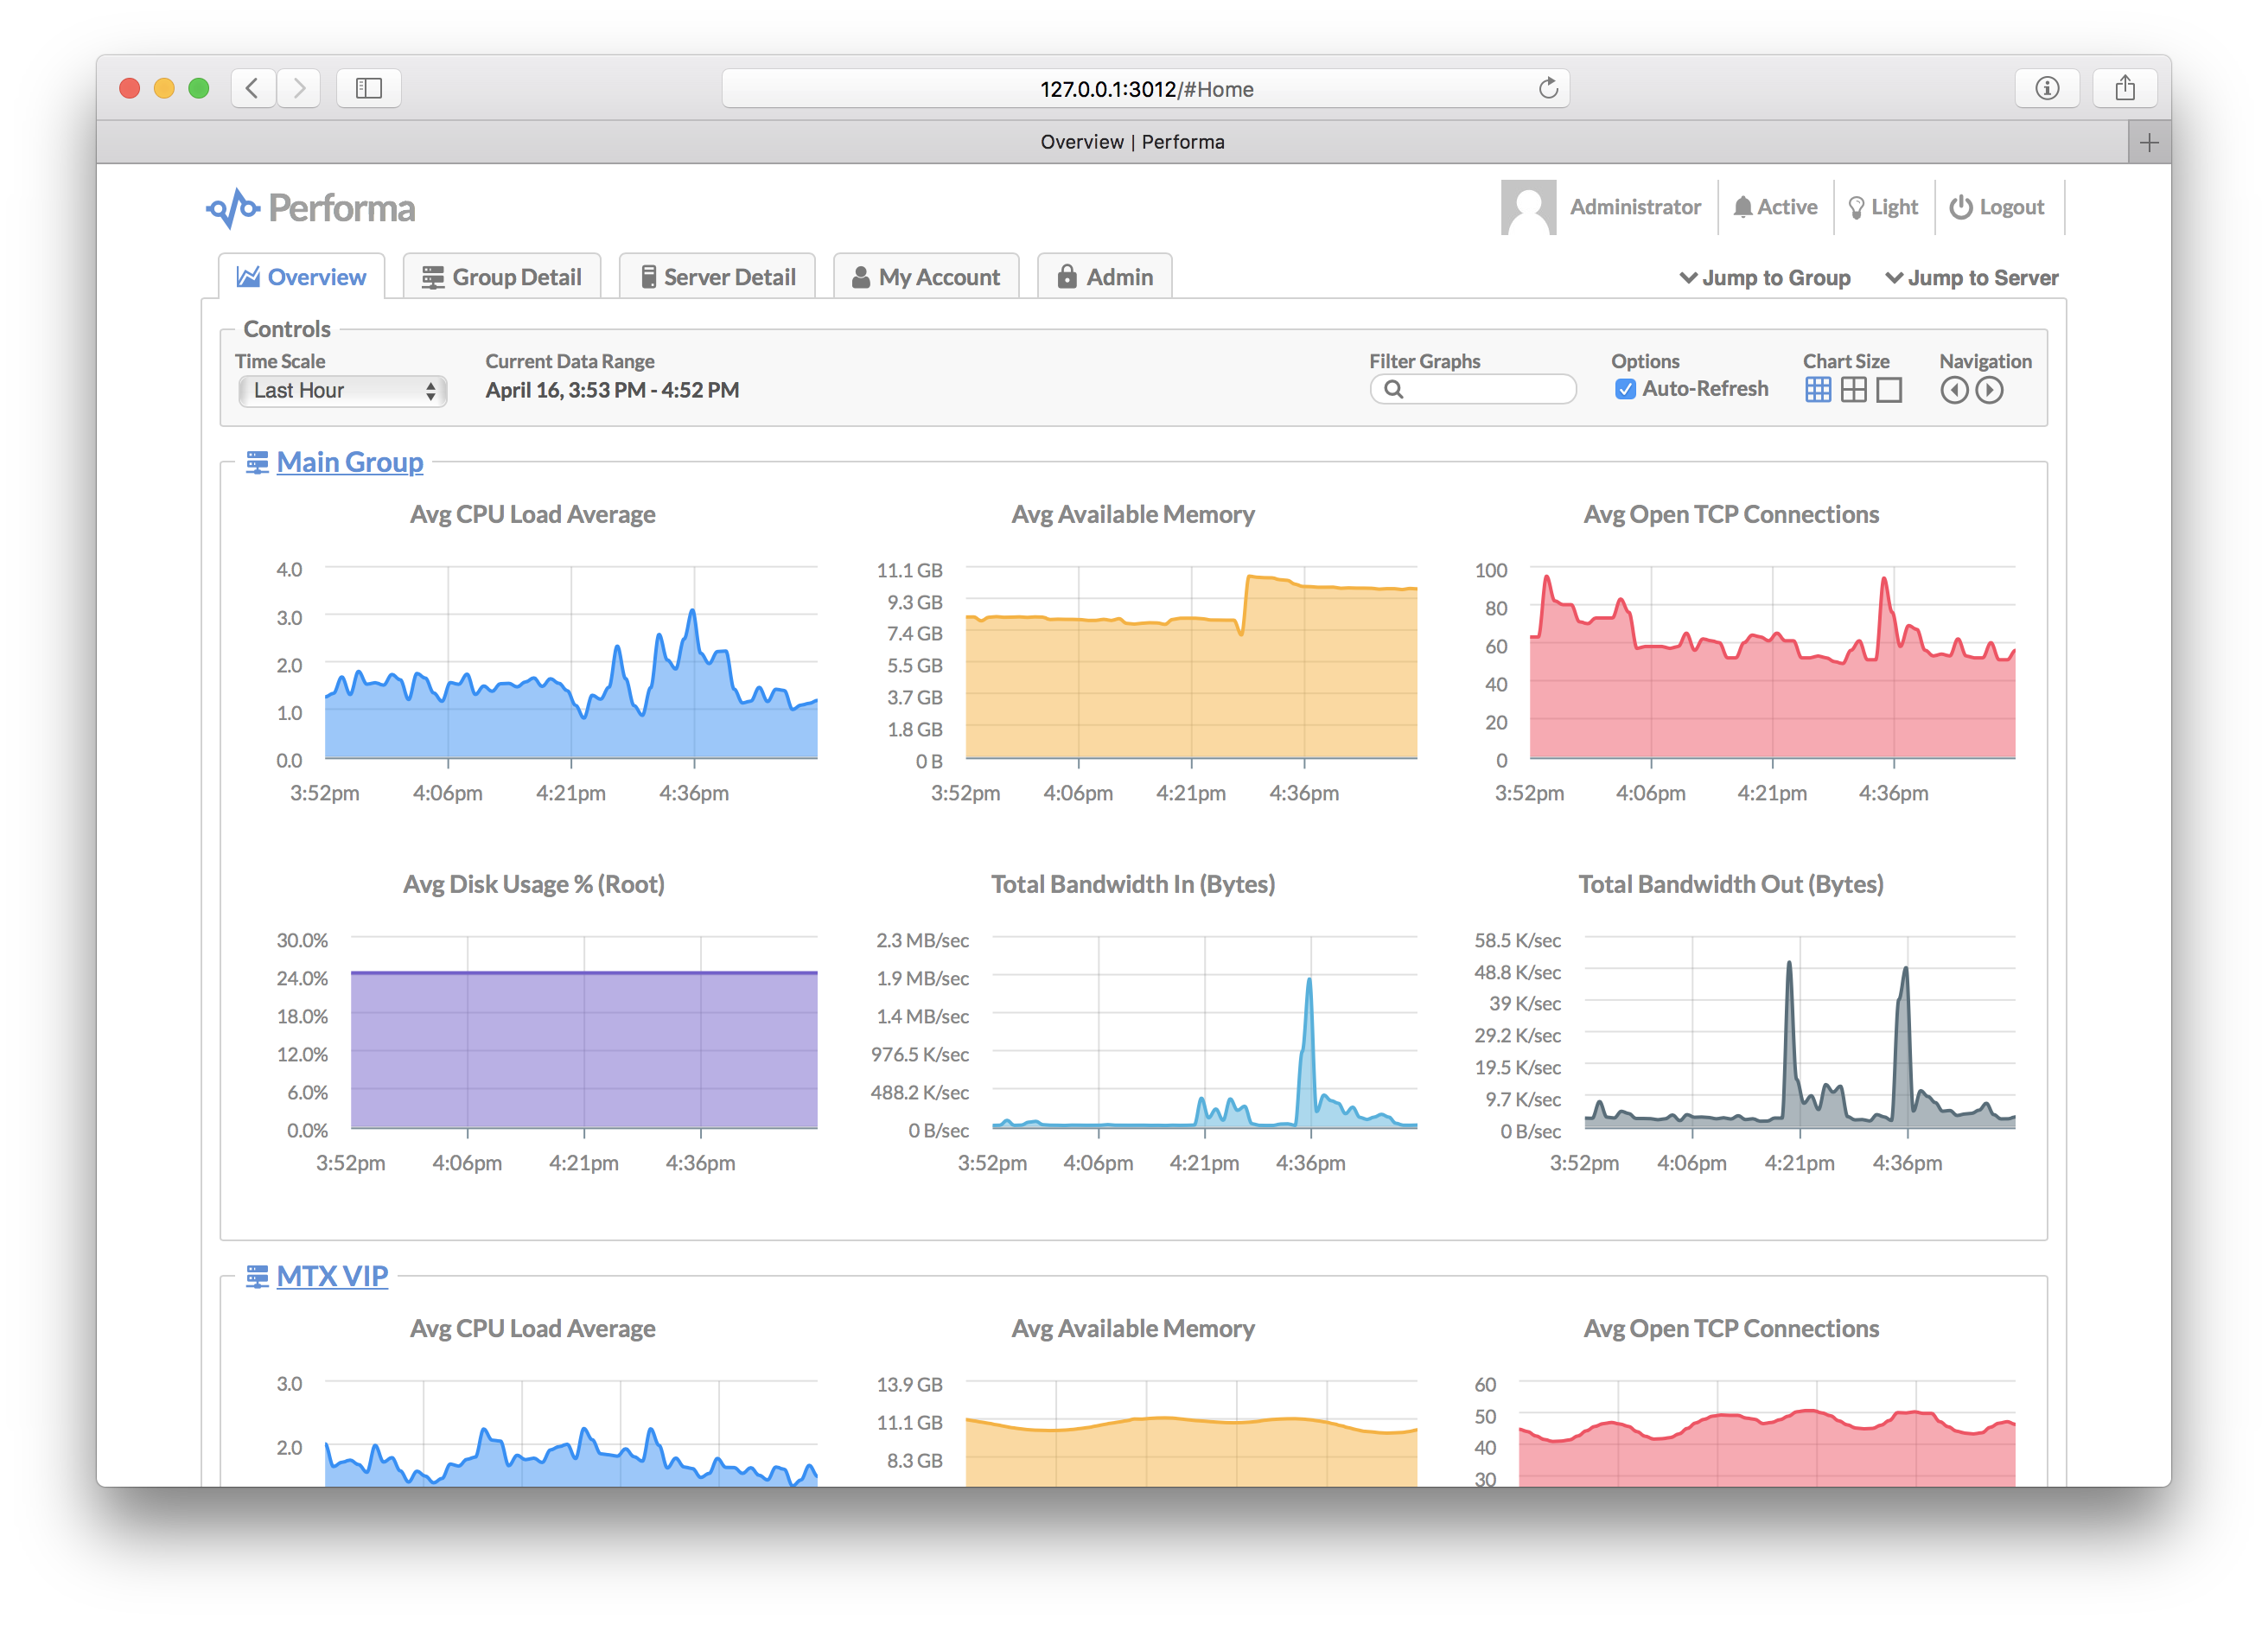
- Real-time views with auto-refreshing graphs
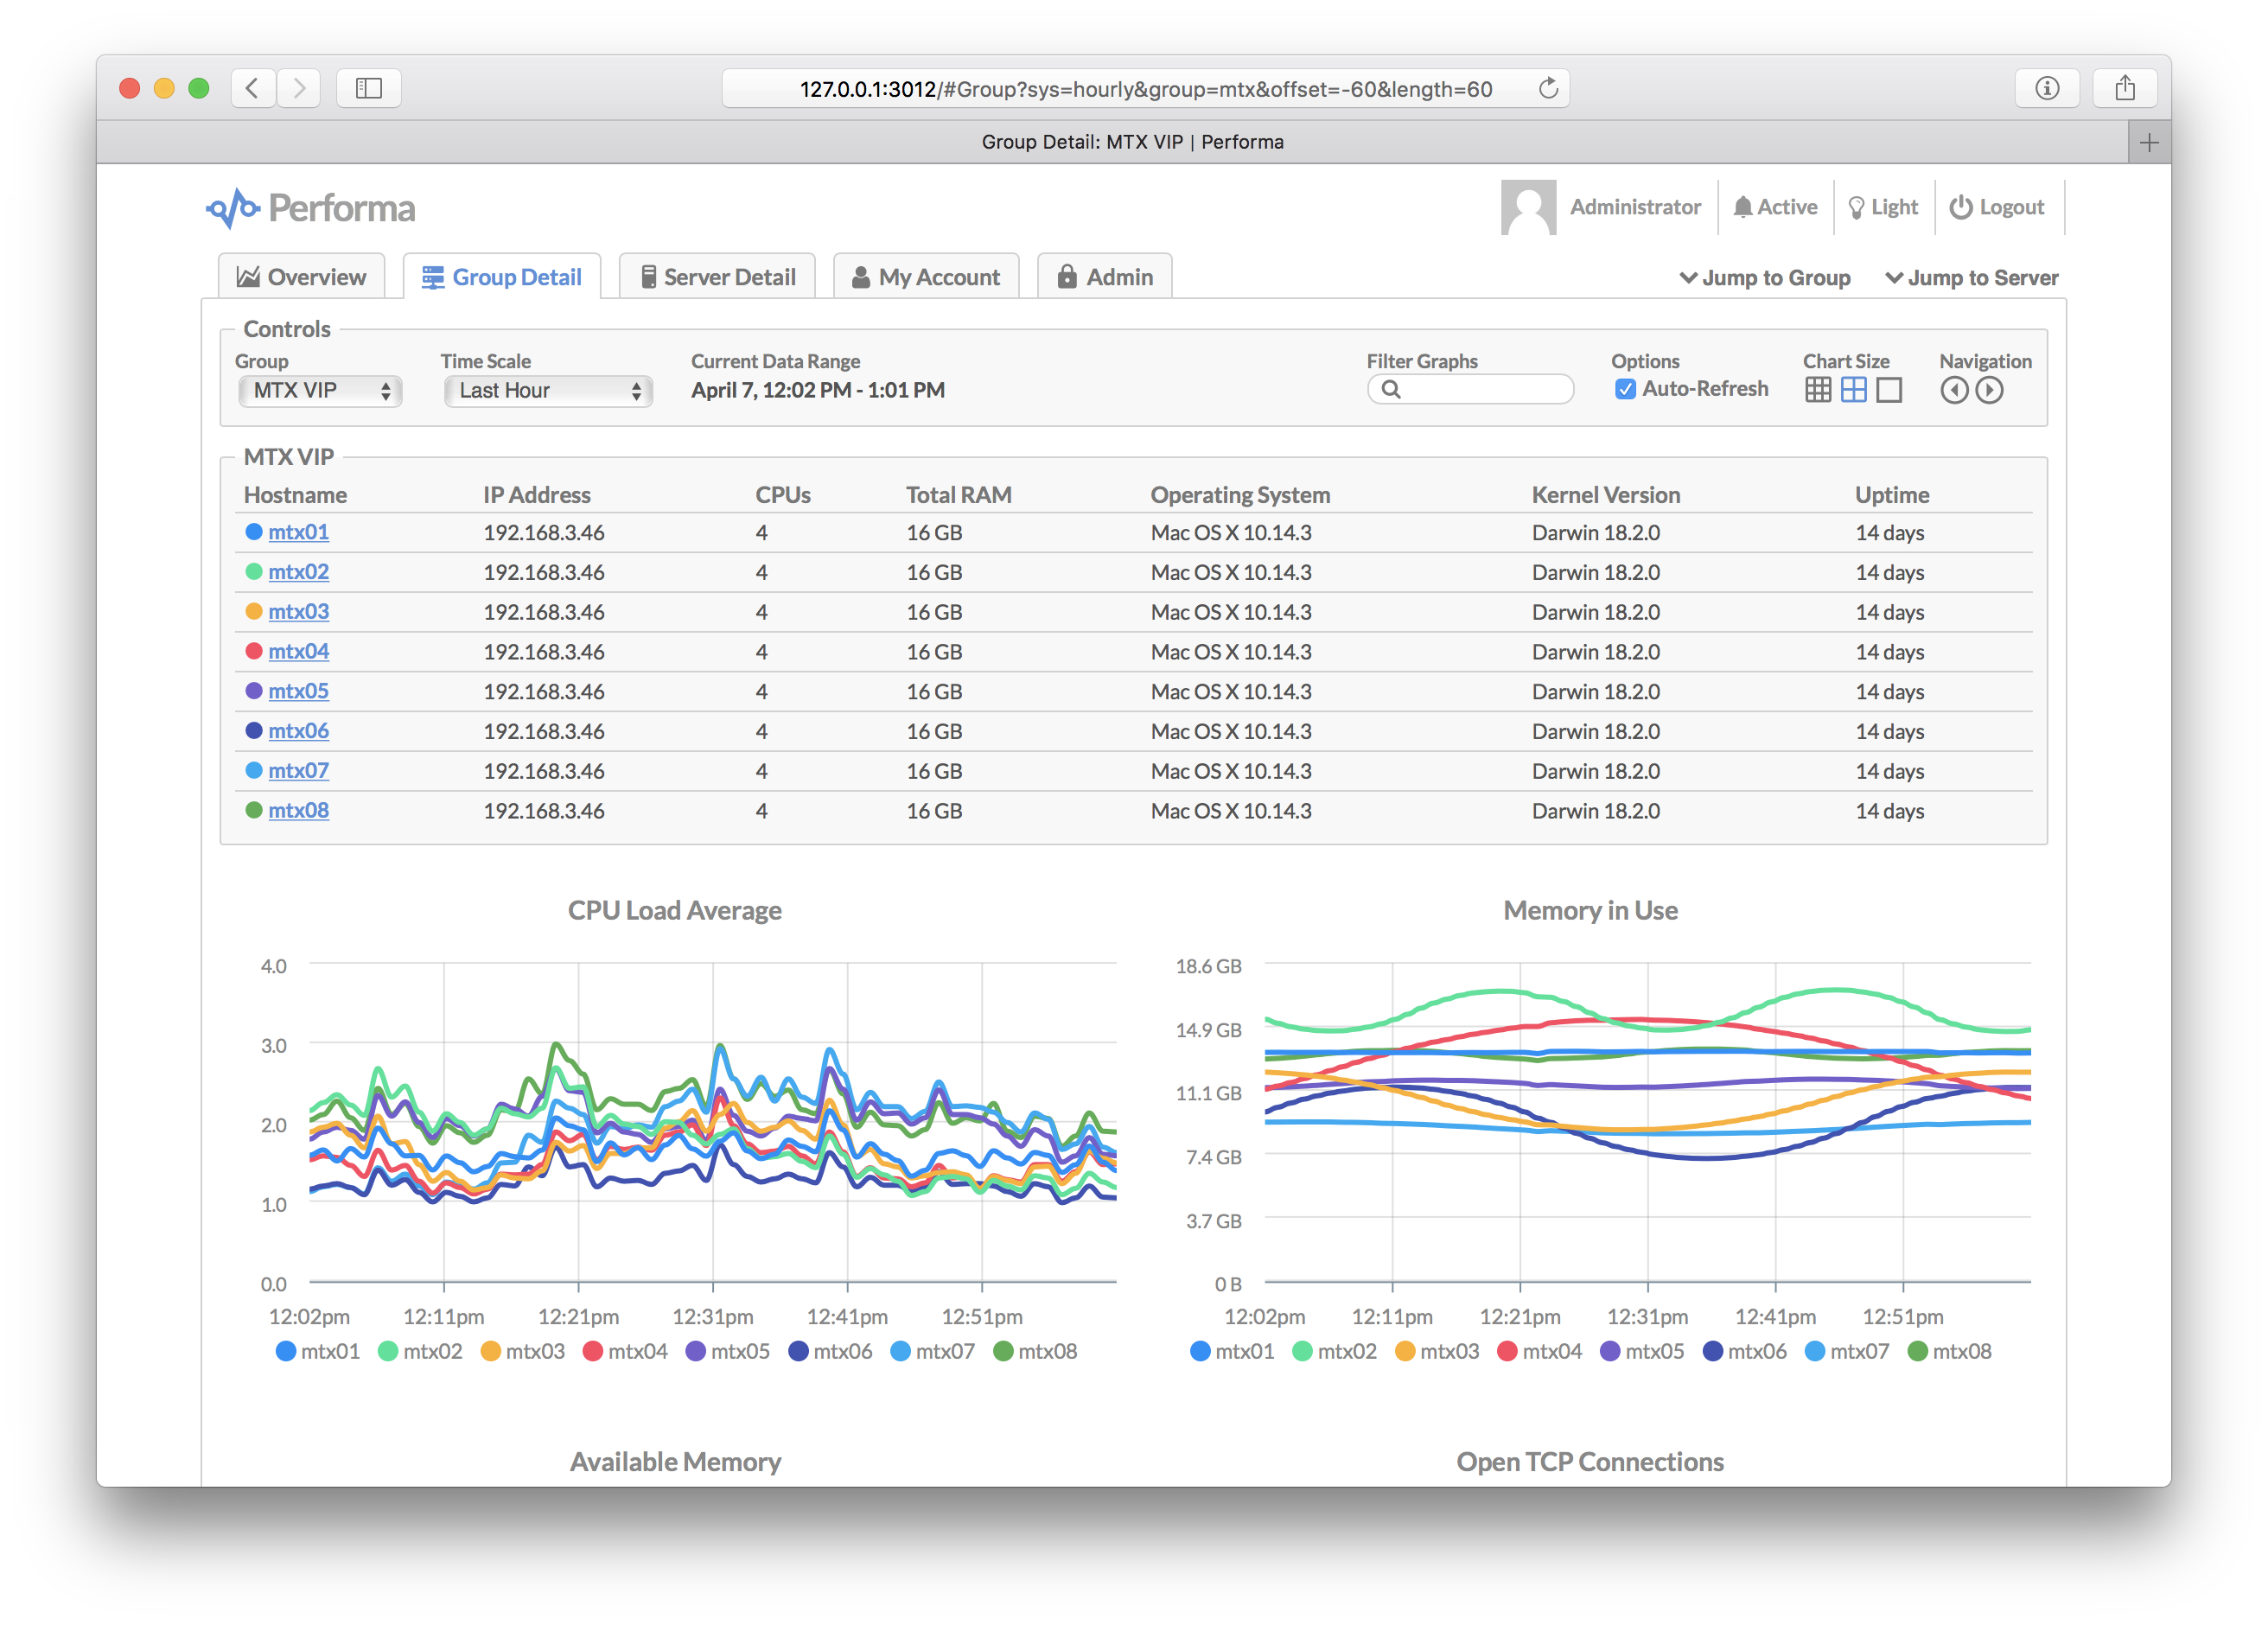
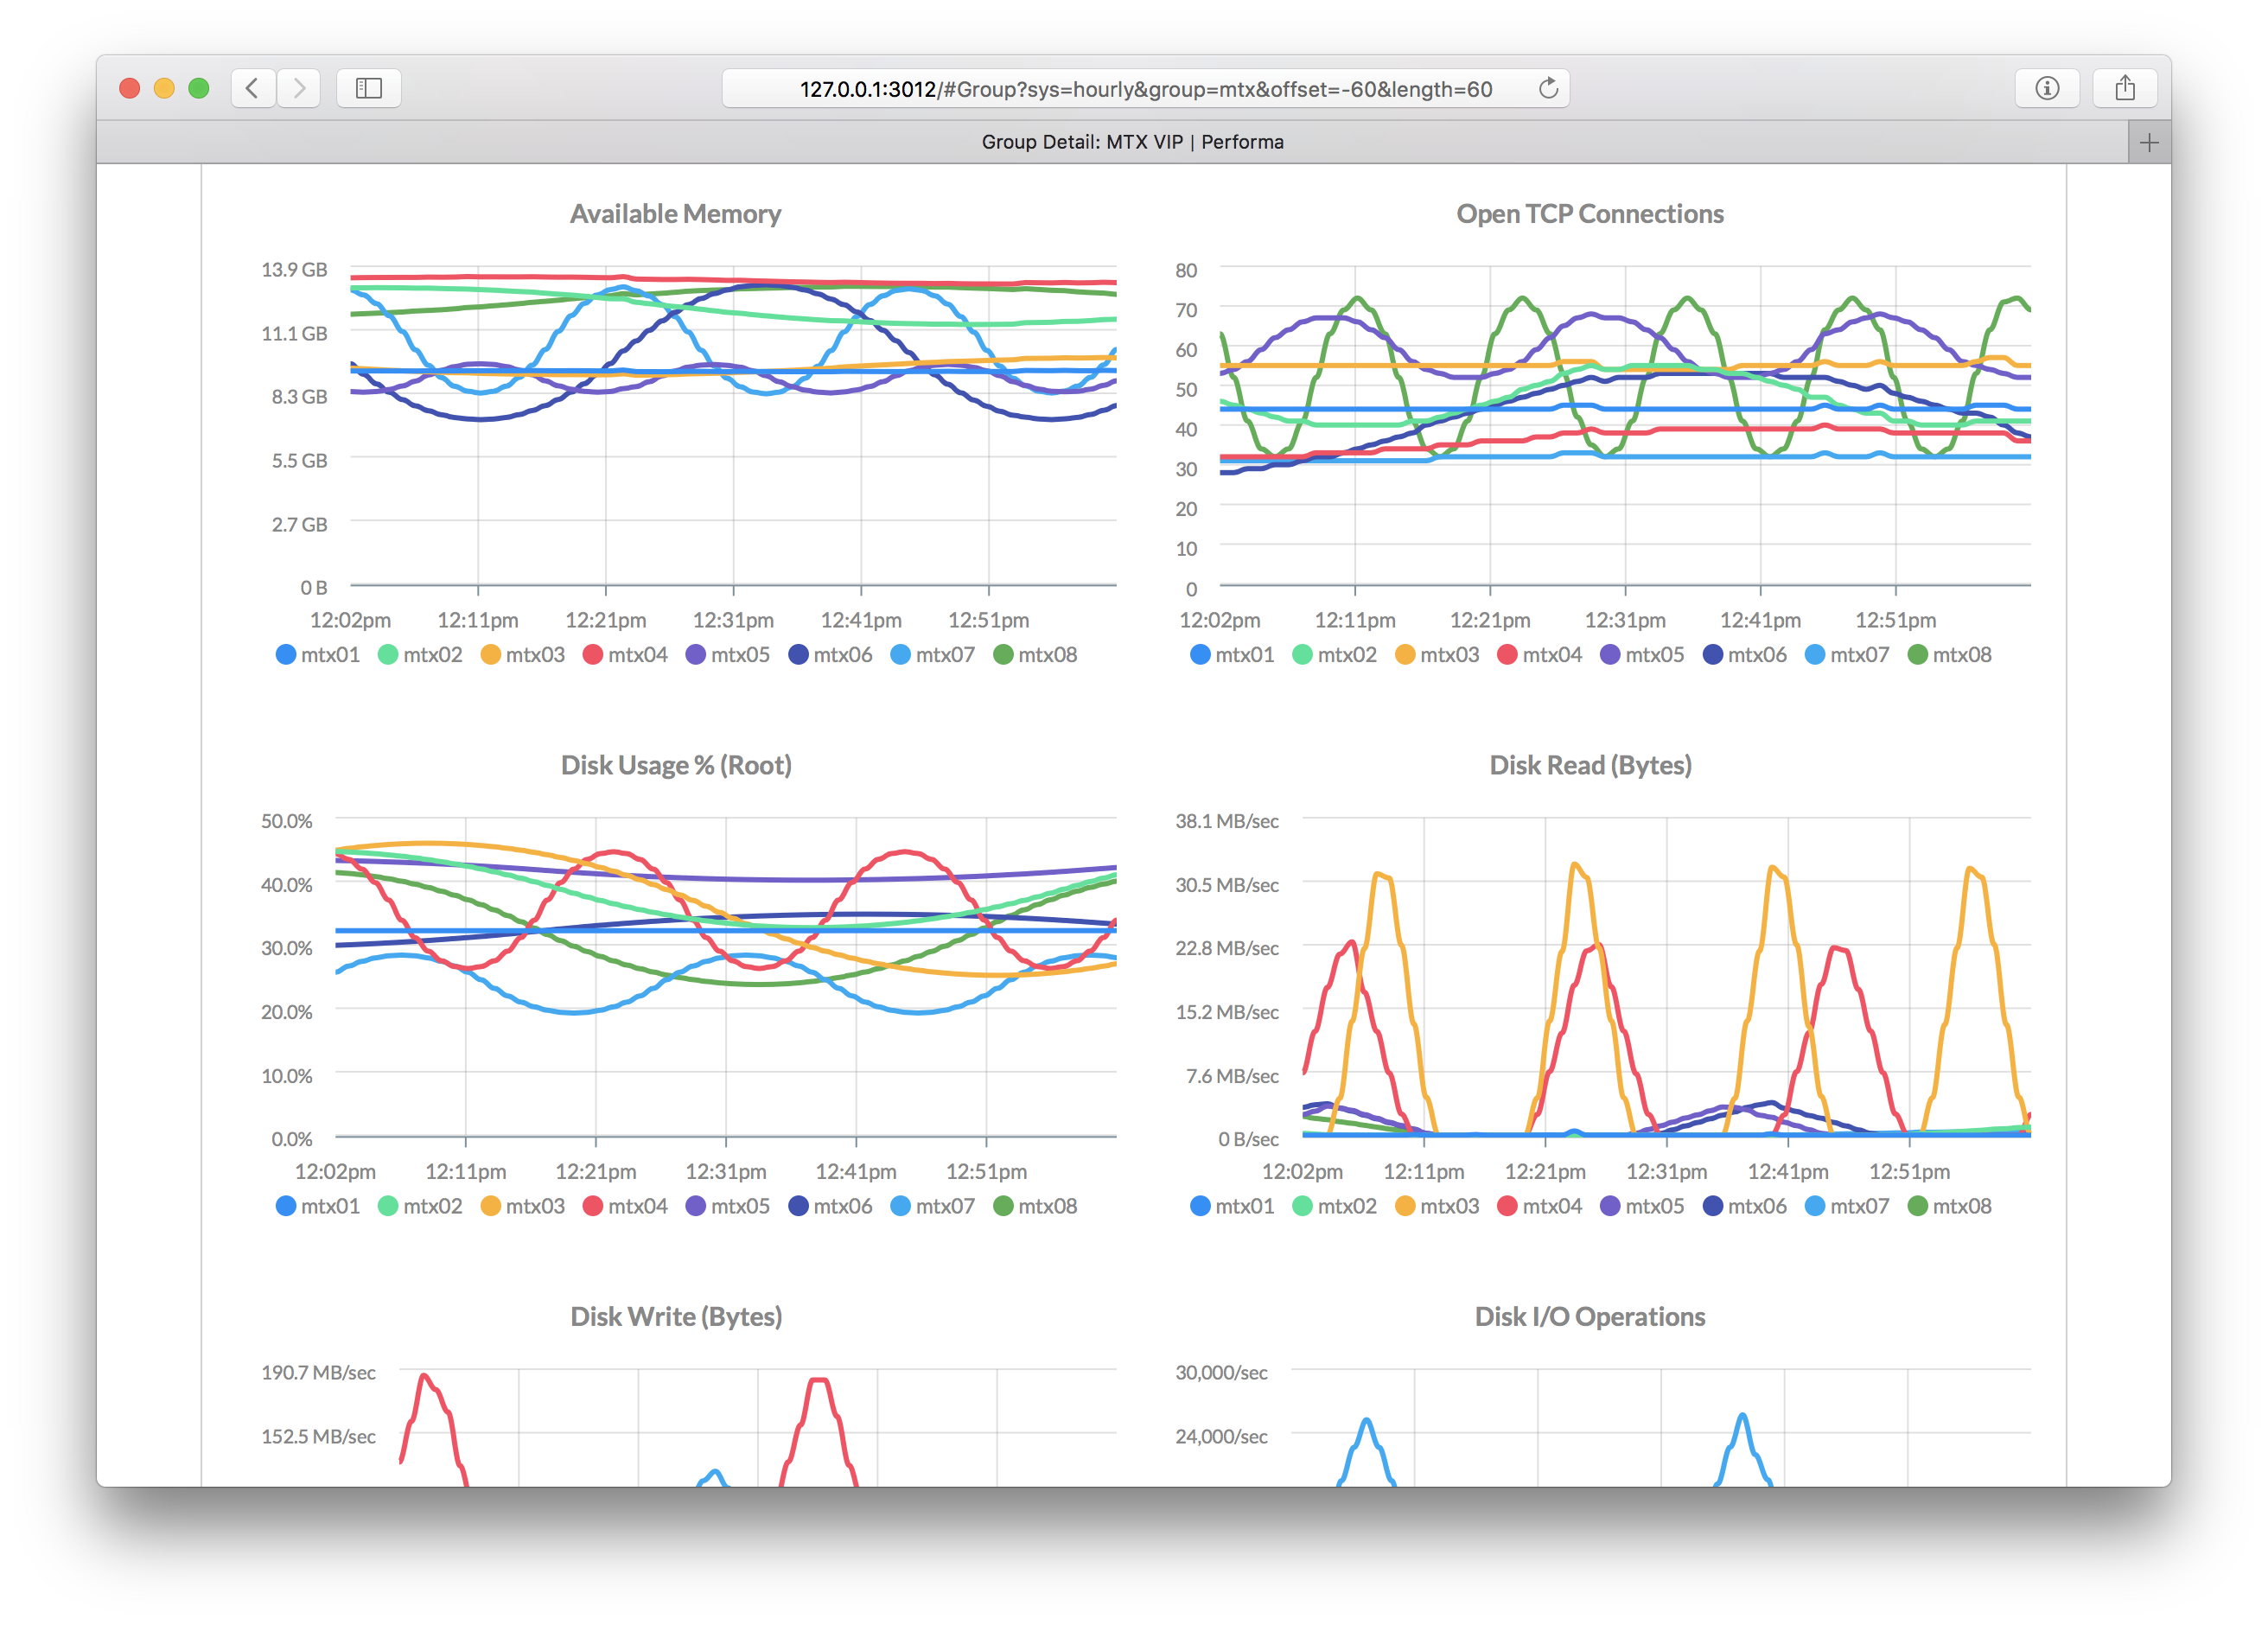
- View graphs for individual servers or entire groups
- Add custom commands for graphing your own metrics
- Alerts with custom trigger expressions
- Alert e-mails and web hooks for notification
- Alert snooze feature to silence notifications
- Snapshot feature provides extra server details
- One click snapshot-to-URL-to-clipboard for graphs
- Graph data can be kept indefinitely or auto-expired
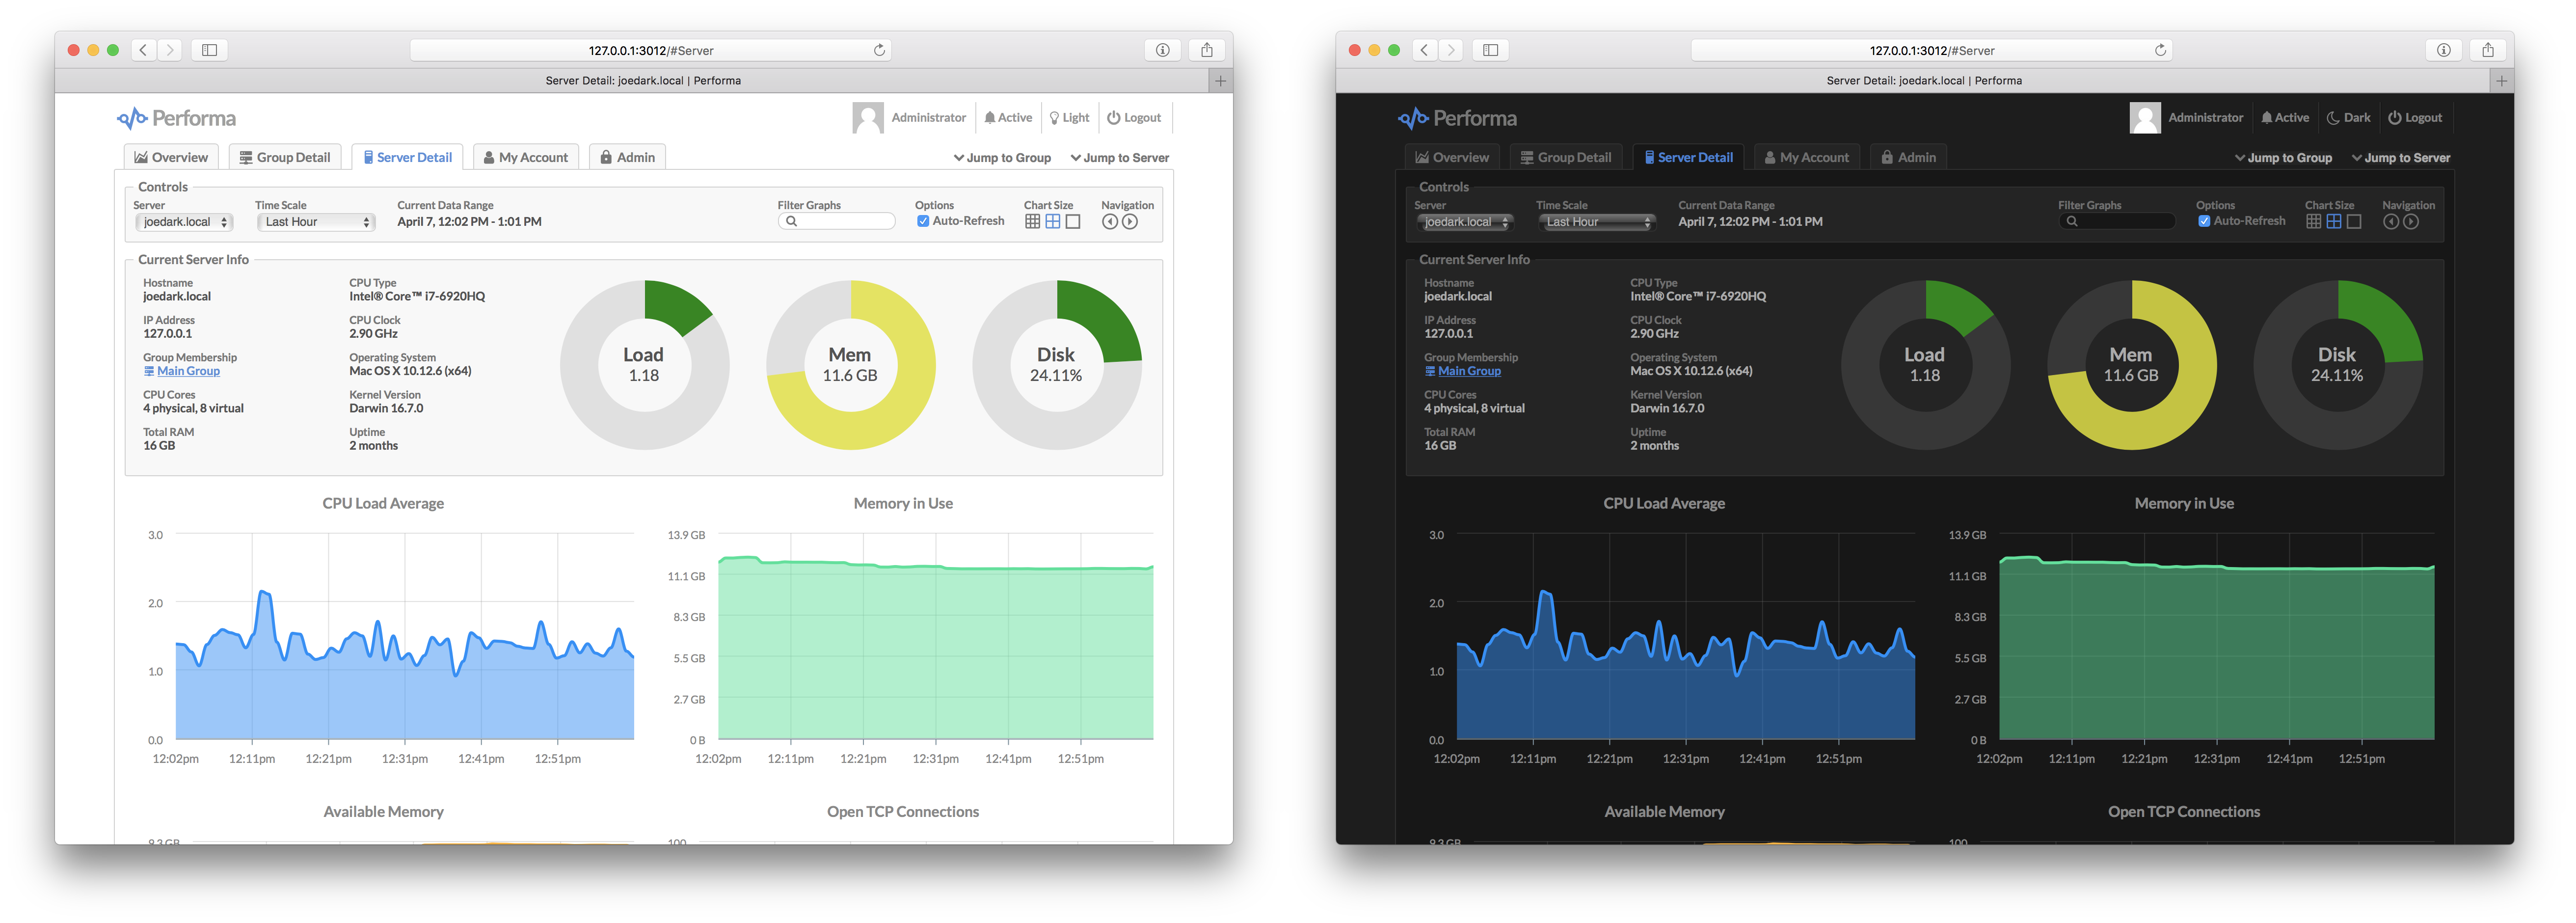
- Light and dark themes for the UI
See Screenshots
A quick introduction to some common terms used in Performa:
| Term | Description |
|---|---|
| Group | A named group of servers which can be targeted by monitors, alerts and/or commands. A server can join a group either by hostname pattern, or explicitly when submitting metrics. See Groups below. |
| Monitor | A monitor is a single graph, which plots a single metric (number) over time, sent in from one or more servers. See Monitors below. |
| Alert | An alert is a trigger that fires when a custom expression, usually involving one or more monitors, evaluates to true. Alerts can send e-mails or fire web hooks. See Alerts below. |
| Command | A command is a custom shell script (or Node, Perl, Python, etc.) that runs on your servers via Performa Satellite, and sends metrics back to the master server. See Commands below. |
| API Key | A special key that can be used by external apps to send API requests into Performa. |
| User | A human user account, which has a username and a password. Passwords are salted and hashed with bcrypt. |
| Satellite | Our headless companion product, which silently collects metrics on your servers and sends them to the master server. See Performa Satellite below. |
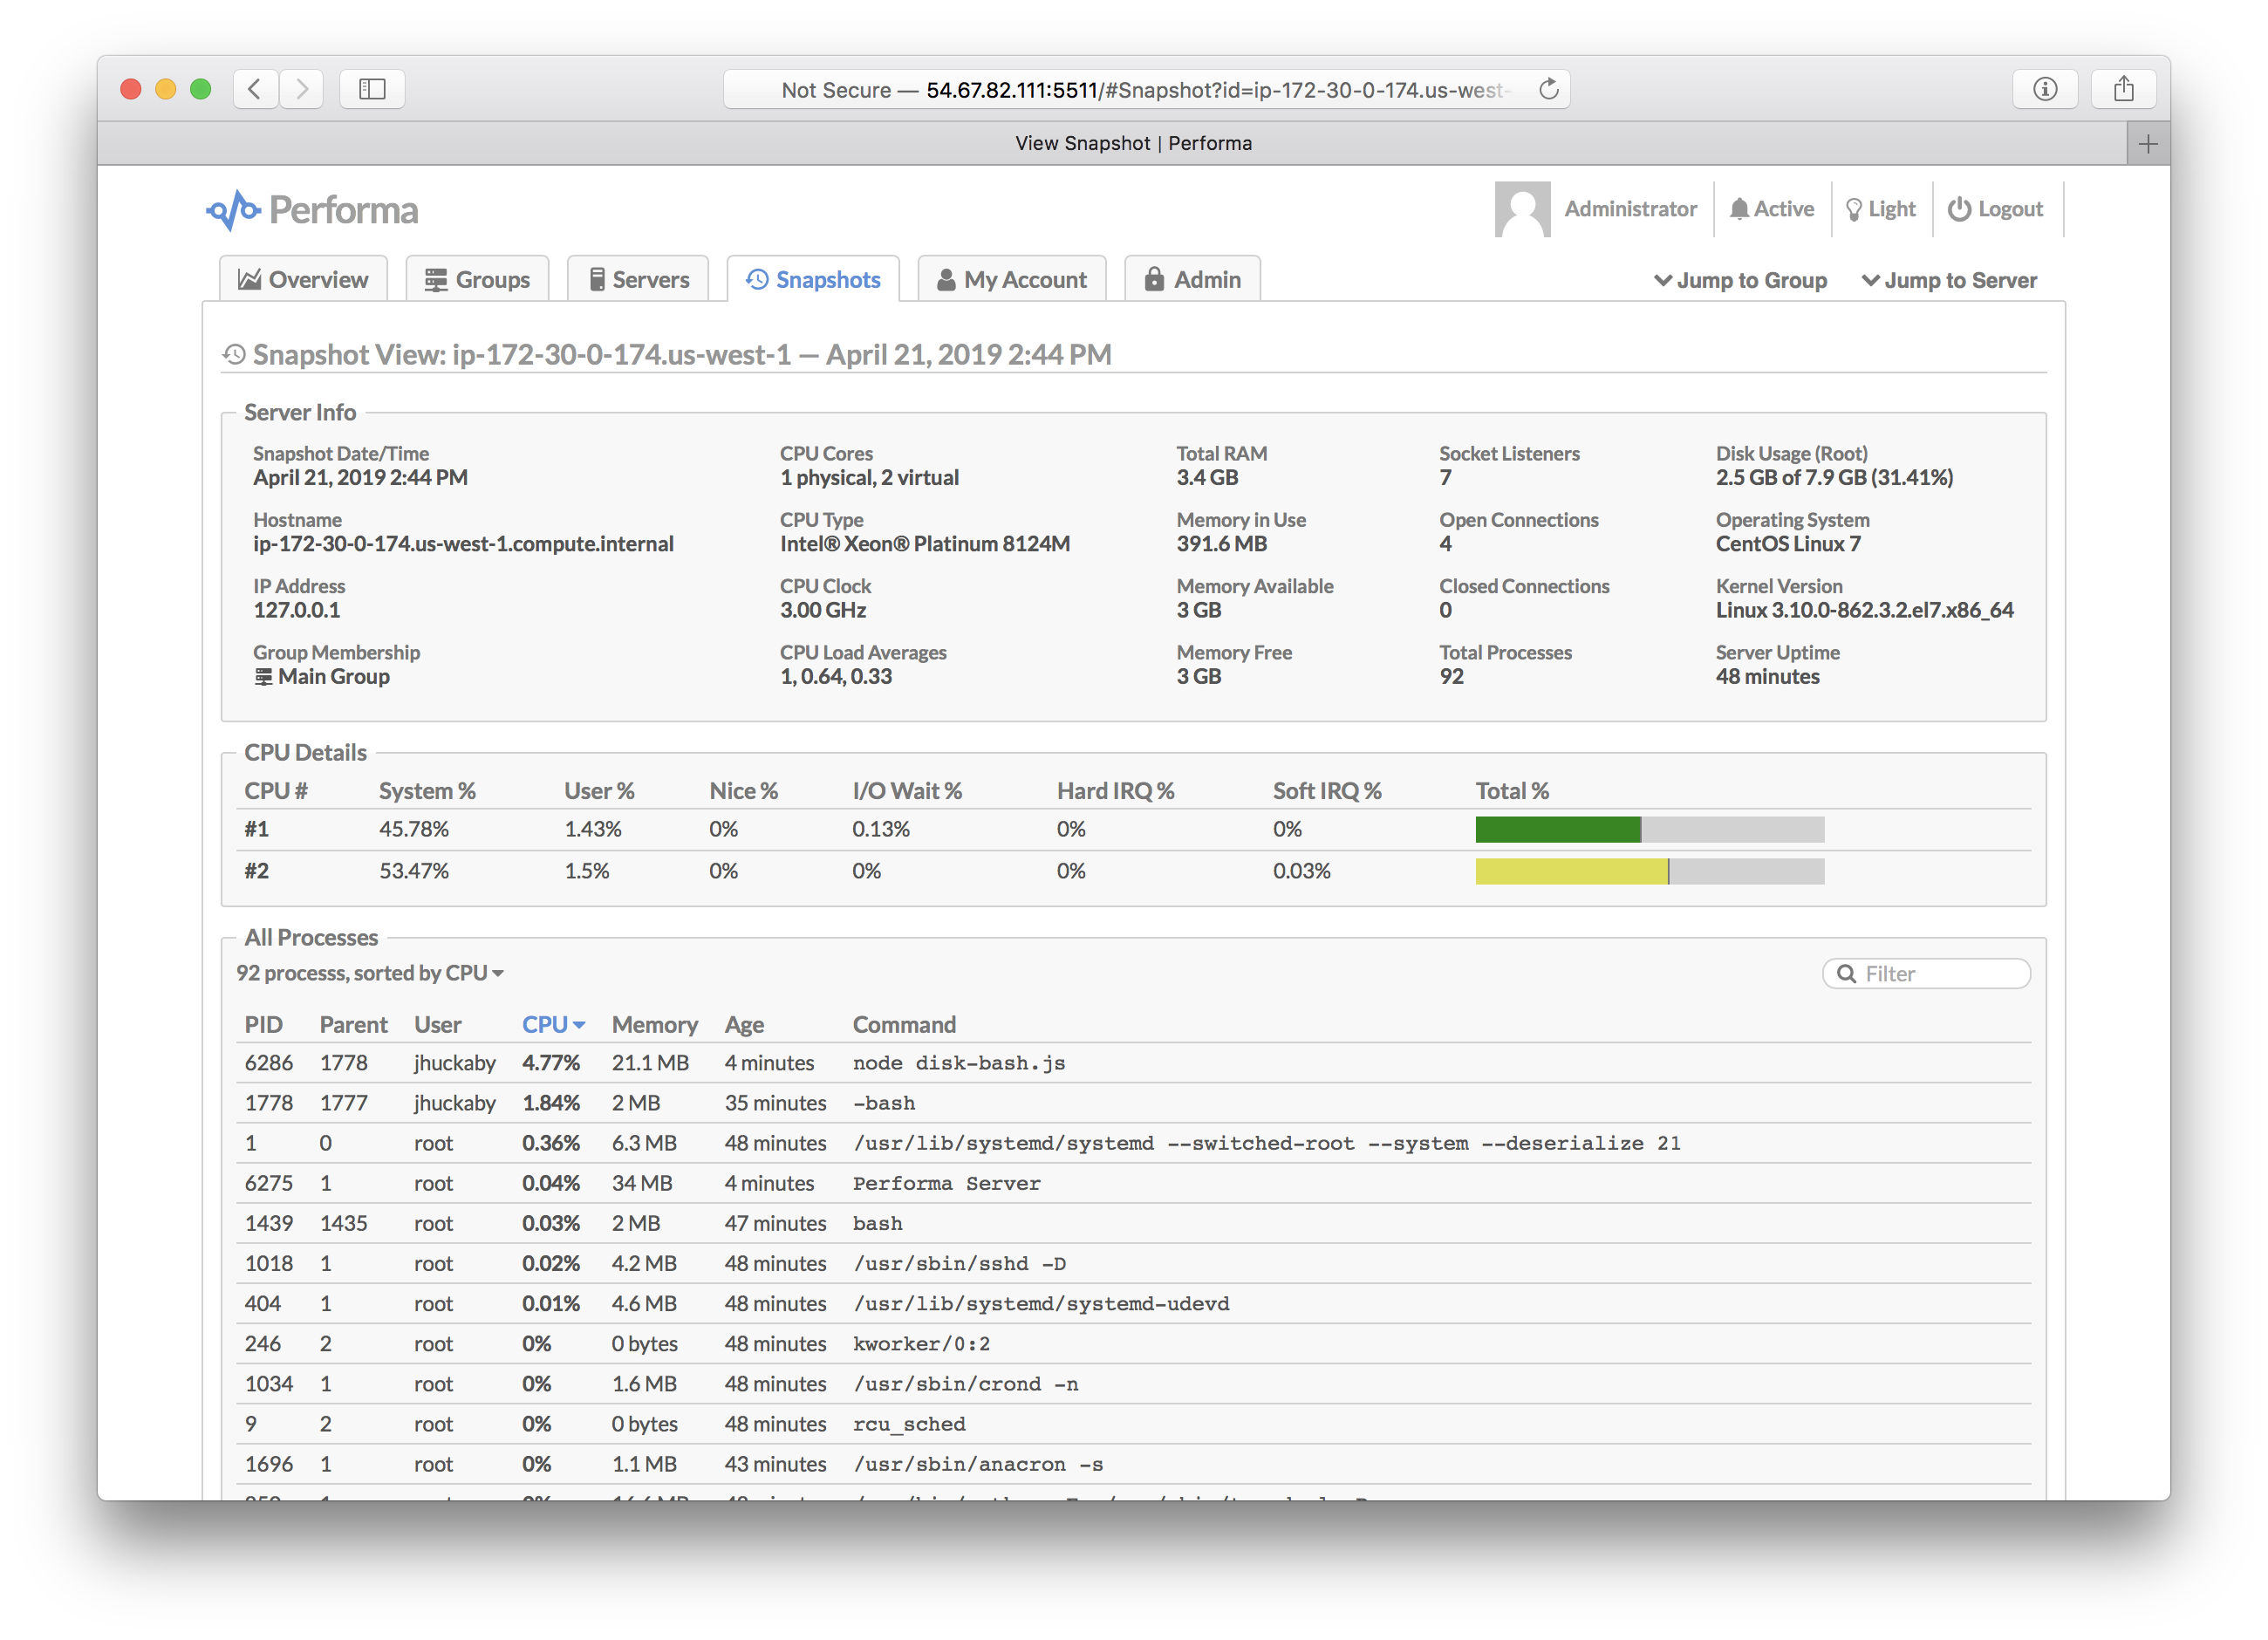
| Snapshot | A snapshot is a detailed record of everything happening on a server, including all processes and network sockets. Snapshots are taken when alerts trigger, and when being watched. See Snapshots below. |
Please note that Performa currently only works on POSIX-compliant operating systems, which basically means Unix/Linux and macOS. If there is enough interest, I'll look into making it work on Windows.
You'll need to have Node.js pre-installed on your master server (you do not need this on any of the servers you are monitoring however). Then become root and type this:
curl -s https://raw.githubusercontent.com/jhuckaby/performa/master/bin/install.js | node
This will install the latest stable release of Performa and all of its dependencies under: /opt/performa/
If you'd rather install it manually (or something went wrong with the auto-installer), here are the raw commands:
mkdir -p /opt/performa
cd /opt/performa
curl -L https://github.com/jhuckaby/performa/archive/v1.0.0.tar.gz | tar zxvf - --strip-components 1
npm install
node bin/build.js dist
Replace v1.0.0 with the desired Performa version from the release list, or master for the head revision (unstable).
If this is your first time installing, please read the Configuration section first. You'll likely want to customize a few configuration parameters in the /opt/performa/conf/config.json file before proceeding. At the very least, you should set these properties:
| Key | Description |
|---|---|
base_app_url |
A fully-qualified URL to Performa on your server, including the http_port if non-standard. This is used in e-mails to create self-referencing URLs. |
email_from |
The e-mail address to use as the "From" address when sending out notifications. |
smtp_hostname |
The hostname of your SMTP server, for sending mail. This can be 127.0.0.1 or localhost if you have sendmail running locally. |
secret_key |
A secret key so you can monitor multiple servers. See secret_key below. |
http_port |
The web server port number for the user interface. Defaults to 5511. |
Now then, the only other decision you have to make is what to use as a storage back-end. Performa can use local disk (easiest setup), Couchbase or Amazon S3.
With that out of the way, run the following script to initialize the storage system. You only need to do this once:
/opt/performa/bin/control.sh setup
Among other things, this creates an administrator user account you can use to login right away. The username is admin and the password is admin. It is recommended you change the password as soon as possible, for security purposes (or just create your own administrator account and delete admin).
At this point you should be able to start the service and access the web UI. Enter this command:
/opt/performa/bin/control.sh start
Then send your browser to the server on the correct port:
http://YOUR_SERVER_HOSTNAME:5511/
You only need to include the port number in the URL if you are using a non-standard HTTP port (see Web Server Configuration).
For monitoring multiple servers see Performa Satellite below.
The main Performa configuration file is in JSON format, and can be found here:
/opt/performa/conf/config.json
Please edit this file directly. It will not be touched by any upgrades. A pristine copy of the default configuration can always be found here: /opt/performa/sample_conf/config.json.
Here are descriptions of the top-level configuration parameters:
This should be set to a fully-qualified URL, pointing to your Performa server, including the HTTP port number if non-standard. Do not include a trailing slash. This is used in e-mails to create self-referencing URLs. Example:
http://local.performa.com:3012
If you are running Performa behind a load balancer, this should be set to the load balanced virtual hostname.
The e-mail address to use as the "From" address when sending out notifications. Most SMTP servers require this to be a valid address to accept mail.
The default e-mail address (or addresses, comma-separated) to send all alert notifications to. This can be overridden at the group and alert level.
The hostname of your SMTP server, for sending mail. This can be set to 127.0.0.1 or localhost if you have sendmail running locally.
The port number to use when communicating with the SMTP server. The default is 25.
Using this optional property you can set specific mailer options, such as SMTP SSL and authentication, which are passed directly to nodemailer. Example:
"mail_options": {
	"secure": true,
	"auth": { "user": "fsmith", "pass": "12345" },
	"connectionTimeout": 10000,
	"greetingTimeout": 10000,
	"socketTimeout": 10000
}
The connectionTimeout, greetingTimeout and socketTimeout properties are all expressed in milliseconds.
You can also use mail_options to use local sendmail, if you have that configured on your server. To do this, set the following properties, and tune as needed:
"mail_options": {
	"sendmail": true,
	"newline": "unix",
	"path": "/usr/sbin/sendmail"
}
You can omit smtp_hostname and smtp_port if you are using sendmail.
For communicating with Performa Satellite, all your servers need to share the same secret key. This is used as a salt string to construct cryptographic authentication tokens, to securely send custom monitoring commands to be executed on your servers. When you install Satellite, you'll need to configure it with the same secret key as the master server.
The installer script will automatically set to this to a random string for you, but you are free to change it to anything you want. Just make sure all your servers have the same shared secret key.
The directory where logs will be written, before they are archived. This can be a partial path, relative to the Performa base directory (/opt/performa) or a full path to a custom location. It defaults to logs (i.e. /opt/performa/logs).
The filename to use when writing logs. You have three options here: a single combined log file for all logs, multiple log files for each component, or multiple log files for each category (debug, transaction, error). See the Logs section below for details.
This is an array of column IDs to log. You are free to reorder or remove some of these, but do not change the names. They are specific IDs that match up to log function calls in the code. See the Logs section below for details.
Every night at midnight (local server time), the logs can be archived (gzipped) to a separate location on disk. This parameter specifies the filesystem path, and the directory naming / filenaming convention of the archive files. It can utilize date placeholders including [yyyy], [mm] and [dd].
This can be a partial path, relative to the Performa base directory (/opt/performa) or a full path to a custom location. It defaults to logs/archives/[yyyy]/[mm]/[dd]/[filename]-[yyyy]-[mm]-[dd].log.gz.
As an alternative to archiving logs on disk via log_archive_path, you can instead archive them to your storage system. This makes sense when using an external storage provider with separate access to your files (like Amazon S3). To use this feature, add a log_archive_storage object with the following syntax:
"log_archive_storage": {
	"enabled": true,
	"key_template": "logs/archives/[yyyy]/[mm]/[dd]/[filename]-[yyyy]-[mm]-[dd].log.gz",
	"expiration": "1 year"
}
The enabled property controls whether the system is active or not. The key_template allows you to archive logs in custom location in your storage system. The expiration sets the expiration date for each log archive, relative to the current date.
Note that if log_archive_path is also set, it takes precedence over this.
The level of verbosity in the debug logs. It ranges from 1 (very quiet) to 10 (extremely loud). The default value is 5.
Performa needs to run storage maintenance once per day, which generally involves deleting expired records and trimming lists which have grown too large. The application is still usable during this time, but UI performance may be slightly impacted.
By default the maintenance is set to run at 4:00 AM (local server time). Feel free to change this to a more convenient time for your server environment. The format of the parameter is HH:MM.
The expiration property sets the data expiration period for all server and group timeline data. It accepts any human-readable relative date string, e.g. 6 months or 10 years. Set this to false to disable expiration, meaning data will never be expired.
This parameter controls how many items are kept in historical lists such as the Activity Log and Snapshots. When this limit is exceeded, the oldest entries are removed during the nightly maintenance run. The default limit is 10000 items. Set this to false to disable expiration.
This has no real effect on performance -- only space on disk (or Couchbase / S3).
The PID file is simply a text file containing the Process ID of the main Performa daemon. It is used by the control.sh script to stop the daemon, and detect if it is running. You should never have to deal with this file directly, and it defaults to living in the logs directory which is auto-created.
This can be a partial path, relative to the Performa base directory (/opt/performa) or a full path to a custom location. However, it should probably not be changed, as the control.sh script expects it to live in logs/performa.pid.
The monitor_self property, when set to true, means that the Performa server will monitor itself by launching Performa Satellite internally (i.e. there is no need to explicitly install it).
The hostname_display_strip is a regular expression that is used to format server hostnames for display. Specifically, whatever matches in the regular expression is stripped off, and the remainder is displayed as the hostname in the UI. It defaults to stripping off the final top-level domain at the end of the hostname, if one is found. The default pattern is:
\.[\w\-]+\.\w+$
The alert_web_hook property is an optional, universal web hook URL, which is requested for every alert, in addition to any group or alert-specific web hooks that may also be configured. See Alert Web Hooks for more details about the web hook system.
In addition to firing web hooks for alert triggers, there are also some other miscellaneous events that you may want to be notified about. Those are defined in an optional system_web_hooks object, formatted like this:
"system_web_hooks": {
	"server_add": "http://myserver.com/webhook/server-add",
	"warning": "http://myserver.com/webhook/warning"
}
If the server_add property is set to a URL, it will be requested whenever a new server is added to the Performa cluster. If the warning property is set to a URL, it will be requested whenever a warning condition is logged. Alternatively, the properties can be set to boolean true, and the alert_web_hook value will be used instead.
The web hook request will be an HTTP POST with a JSON payload. The JSON will contain details about the action, specifically a text property describing it.
The new_server_stale_threshold property sets the maximum number of seconds to allow for an old server to come back online without considering it to be "new". Meaning, if a server disappears for more than new_server_stale_threshold seconds (default 3600) then comes back online, it is considered to be "new" again, and a notification is sent out, and an entry is added to the activity log. This only affects logging and notifications.
If you want, you can override any settings for the ApexCharts library, which is used to render all of the Performa charts. See the graph_overrides object in the config file (located inside the client object), which is formatted like this:
"graph_overrides": {
	"all_sizes": {
		"stroke.curve": "smooth",
		"markers.style": "hollow",
		"title.align": "center",
		"grid.show": true
	},
	"full": {
		"chart.height": 400,
		"title.fontSize": 16,
		"stroke.width": 3
	},
	"half": {
		"chart.height": 300,
		"title.fontSize": 15,
		"stroke.width": 2
	},
	"third": {
		"chart.height": 200,
		"title.fontSize": 14,
		"stroke.width": 2
	}
}
The all_sizes object will apply overrides to all three graph sizes, whereas the full, half and third objects apply overrides to their respective graph size setting. The full, half and third take precedence over all_sizes, if the same overrides exist in both places. Inside the objects, the format of the ApexCharts configuration overrides is in "dot notation", so you can apply deep nested overrides. For example, consider this override:
"stroke.curve": "smooth",This controls the ApexCharts curve setting, which is inside the stroke group. For details on this, see the stroke documentation for details. Similarly, this setting:
"title.align": "center",This controls the ApexCharts align setting, which is inside the title group. For details on this one, see the title documentation.
The Storage object contains settings for the Performa storage system. This is built on the pixl-server-storage module, which can write everything to local disk (the default), Couchbase or Amazon S3.
To select a storage engine, place one of the following values into the engine property:
The default storage method is to use local disk. For this, set the engine property to Filesystem, and declare a sub-object with the same name, with a couple more properties:
{
	"Storage": {
		"engine": "Filesystem",
		"Filesystem": {
			"base_dir": "data",
			"key_namespaces": 1
		}
	}
}
The base_dir is the base directory to store everything under. It can be a fully-qualified filesystem path, or a relative path to the Performa base directory (e.g. /opt/performa). In this case it will be /opt/performa/data.
For more details on using the Filesystem as a backing store, please read the Local Filesystem section in the pixl-server-storage docs.
To use Couchbase as a backing store for Performa, please read the Couchbase section in the pixl-server-storage docs. It has complete details for how to setup the storage object. Example configuration:
{
	"Storage": {
		"engine": "Couchbase",
		"Couchbase": {
			"connectString": "couchbase://127.0.0.1",
			"bucket": "default",
			"password": "",
			"serialize": false,
			"keyPrefix": "performa"
		}
	}
}
If you are sharing a bucket with other applications, use the keyPrefix property to keep the Performa data separate, in its own "directory". For example, set keyPrefix to "performa" to keep all the Performa-related records in a top-level performa directory in the bucket.
You'll also need to install the npm couchbase module:
cd /opt/performa
npm install couchbase
After configuring Couchbase, you'll need to run the Performa setup script manually, to recreate all the base storage records needed to bootstrap the system:
/opt/performa/bin/control.sh setup
To use Amazon S3 as a backing store for Performa, please read the Amazon S3 section in the pixl-server-storage docs. It has complete details for how to setup the storage object. Example configuration:
{
	"Storage": {
		"engine": "S3",
		"AWS": {
			"accessKeyId": "YOUR_AMAZON_ACCESS_KEY",
			"secretAccessKey": "YOUR_AMAZON_SECRET_KEY",
			"region": "us-west-1",
			"correctClockSkew": true,
			"maxRetries": 5,
			"httpOptions": {
				"connectTimeout": 5000,
				"timeout": 5000
			}
		},
		"S3": {
			"keyPrefix": "performa",
			"fileExtensions": true,
			"params": {
				"Bucket": "YOUR_S3_BUCKET_ID"
			},
			"cache": {
				"enabled": true,
				"maxItems": 1000,
				"maxBytes": 10485760
			}
		}
	}
}
If you are sharing a bucket with other applications, use the keyPrefix property to keep the Performa data separate, in its own "directory". For example, set keyPrefix to "performa" to keep all the Performa-related records in a top-level performa directory in the S3 bucket. A trailing slash will be automatically added to the prefix if missing.
It is recommended that you always set the S3 fileExtensions property to true for new installs. This makes the Performa S3 records play nice with sync / copy tools such as Rclone.
To use S3 you'll also need to install the npm aws-sdk module:
cd /opt/performa
npm install aws-sdk
After configuring S3, you'll need to run the Performa setup script manually, to recreate all the base storage records needed to bootstrap the system:
/opt/performa/bin/control.sh setup
Performa has an embedded web server which handles serving up the user interface. This is configured in the WebServer object, and there are only a handful of parameters you should ever need to configure:
{
	"WebServer": {
		"http_port": 5511,

		"https": false,
		"https_port": 5522,
		"https_cert_file": "conf/ssl.crt",
		"https_key_file": "conf/ssl.key"
	}
}
Changing the http_port is probably the most common thing you will want to customize. For example, if you don't have anything else running on port 80, you will probably want to change it to that, so you can access the UI without entering a port number.
This is also where you can enable HTTPS, if you want the UI to be SSL encrypted. Set the https property to true to enable, and configure the https_port as you see fit (the standard HTTPS port is 443). You will have to supply your own SSL certificate files (sample self-signed certs are provided for testing, but they will generate browser warnings).
For more details on the web server component, please see the pixl-server-web module documentation.
Performa has a simple user login and management system, which is built on the pixl-server-user module. It handles creating new users, assigning permissions, and login / session management. It is configured in the User object, and there are only a couple of parameters you should ever need to configure:
{
	"User": {
		"free_accounts": false,

		"default_privileges": {
			"admin": 0
		}
	}
}
The free_accounts property specifies whether guests visiting the UI can create their own accounts, or not. This defaults to false (disabled), but you can set it to true to enable. This feature should only be used when your install of Performa is running on a private network, and you trust all your employees.
The default_privileges object specifies which privileges new accounts will receive by default. Here is a list of all the possible privileges and what they mean:
| Privilege ID | Description |
|---|---|
admin |
User is a full administrator. |
By default new users have no privileges, meaning they can view all graphs but not make any changes. Note that when an administrator creates new accounts via the UI, (s)he can customize the privileges at that point. The configuration only sets the defaults.
For more details on the user manager component, please see the pixl-server-user module documentation.
Performa will send a number of different types of e-mails in response to certain events. These are mostly confirmations of actions, or just alert notifications. Most of these can be disabled in the UI if desired. The e-mail content is also configurable, including the From and Subject headers, and is based on plain text e-mail template files located on disk:
| Action | Email Template | Description |
|---|---|---|
| New Alert | conf/emails/alert_new.txt |
Sent when a new server alert is triggered. |
| Alert Cleared | conf/emails/alert_cleared.txt |
Sent when a server alert is cleared. |
| New User Account | conf/emails/welcome_new_user.txt |
Sent when a new user account is created. |
| Changed Password | conf/emails/changed_password.txt |
Sent when a user changes their password. |
| Recover Password | conf/emails/recover_password.txt |
Sent when a user requests password recovery. |
Feel free to edit these files to your liking. Note that any text in [/square_brackets] is a placeholder which gets swapped out with live data relevant to the event which fired off the e-mail.
The stock e-mail templates shipped with Performa are plain text, but you can provide your own rich HTML e-mail templates if you want. Simply start the e-mail body content (what comes after the Subject line) with an HTML open tag, e.g. <div>, and the e-mails will be sent as HTML instead of text.
You can include any property from the main conf/config.json file by using the syntax [/config/KEY]. Also, to include environment variables, use the syntax [/env/ENV_KEY], for example [/env/NODE_ENV].
Performa Satellite is our headless companion product, which silently collects metrics on your servers and sends them to the Performa master server. It has no dependencies and ships as a precompiled binary (for Linux and macOS), so it will be compatible with a wide range of systems. It does not run as a daemon, but instead launches via cron every minute, then exits. It uses about 25 MB of RAM while it is active (usually only a few seconds per minute).
For more information about Performa Satellite, including installation and configuration instructions, please see the Performa Satellite GitHub Repo.
Performa allows you to define any number of server groups. Each server is assigned to a group when it submits metrics, either automatically by matching its hostname to a pattern (i.e. regular expression), or manually by the server including it with the metrics data.
Each group has the following properties:
| Property | Description |
|---|---|
| ID | A unique alphanumeric ID for the group, used when servers manually specify their group. |
| Title | A display title (label) for the group, shown in the UI. |
| Hostname Match | To automatically include servers in the group, you can specify a regular expression pattern to match them by their hostnames. If omitted, servers can specify the Group ID in their Performa Satellite configuration. |
| Alerts Enabled | You can optionally enable / disable all alert notifications at the group level. |
| Alert Email | Optionally specify a default alert e-mail address for notifications (note that individual alerts can override this). |
| Alert Web Hook | Optionally specify a default alert web hook URL for notifications (note that individual alerts can override this). |
| Notes | A notes text field is provided for your own internal use. |
To automatically include servers in a group, you can specify a "hostname match", which is just a regular expression pattern. If any servers submit metrics with a hostname that matches the group pattern, they are auto-assigned to the group. Example:
^(test01|perf02|prod\\d+)\\.
This would match any of the following server hostnames:
test01.mycompany.com
perf02.local
prod005.mycluster.org
If you don't know regular expression syntax, you can simply add a list of fully-qualified hostnames, separated by pipes (|). Or to match any server, set the field to .+.
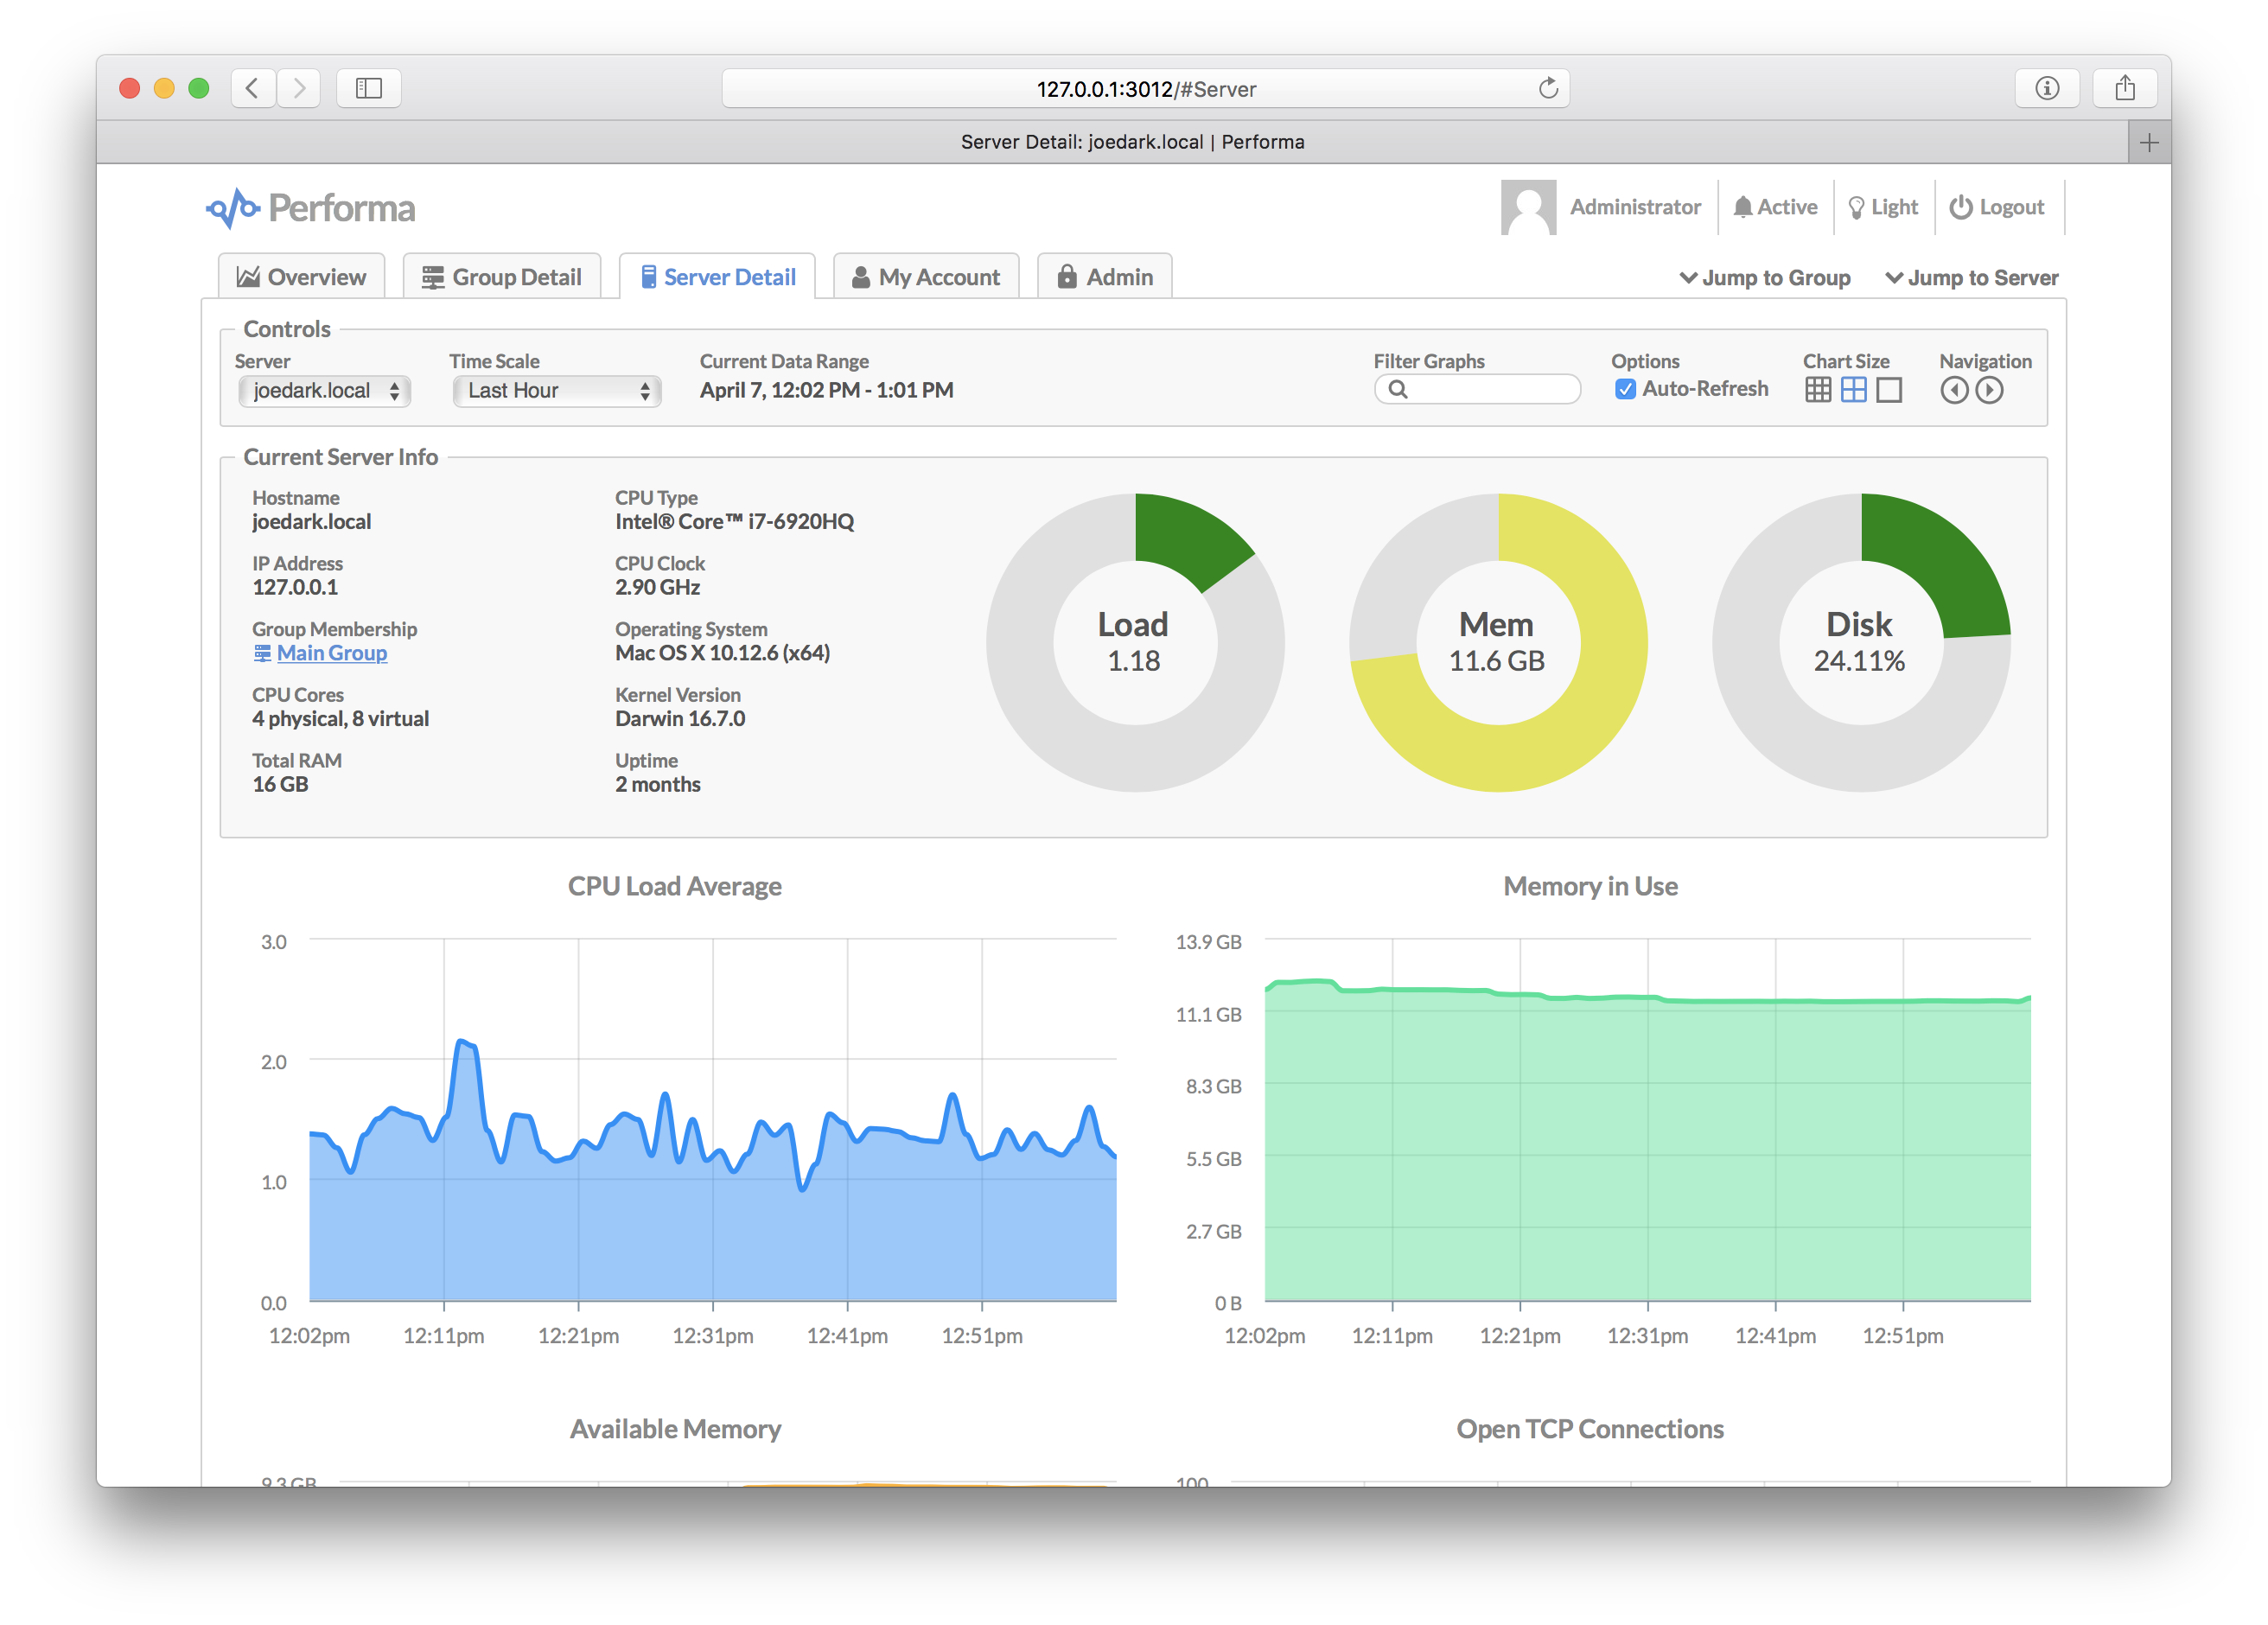
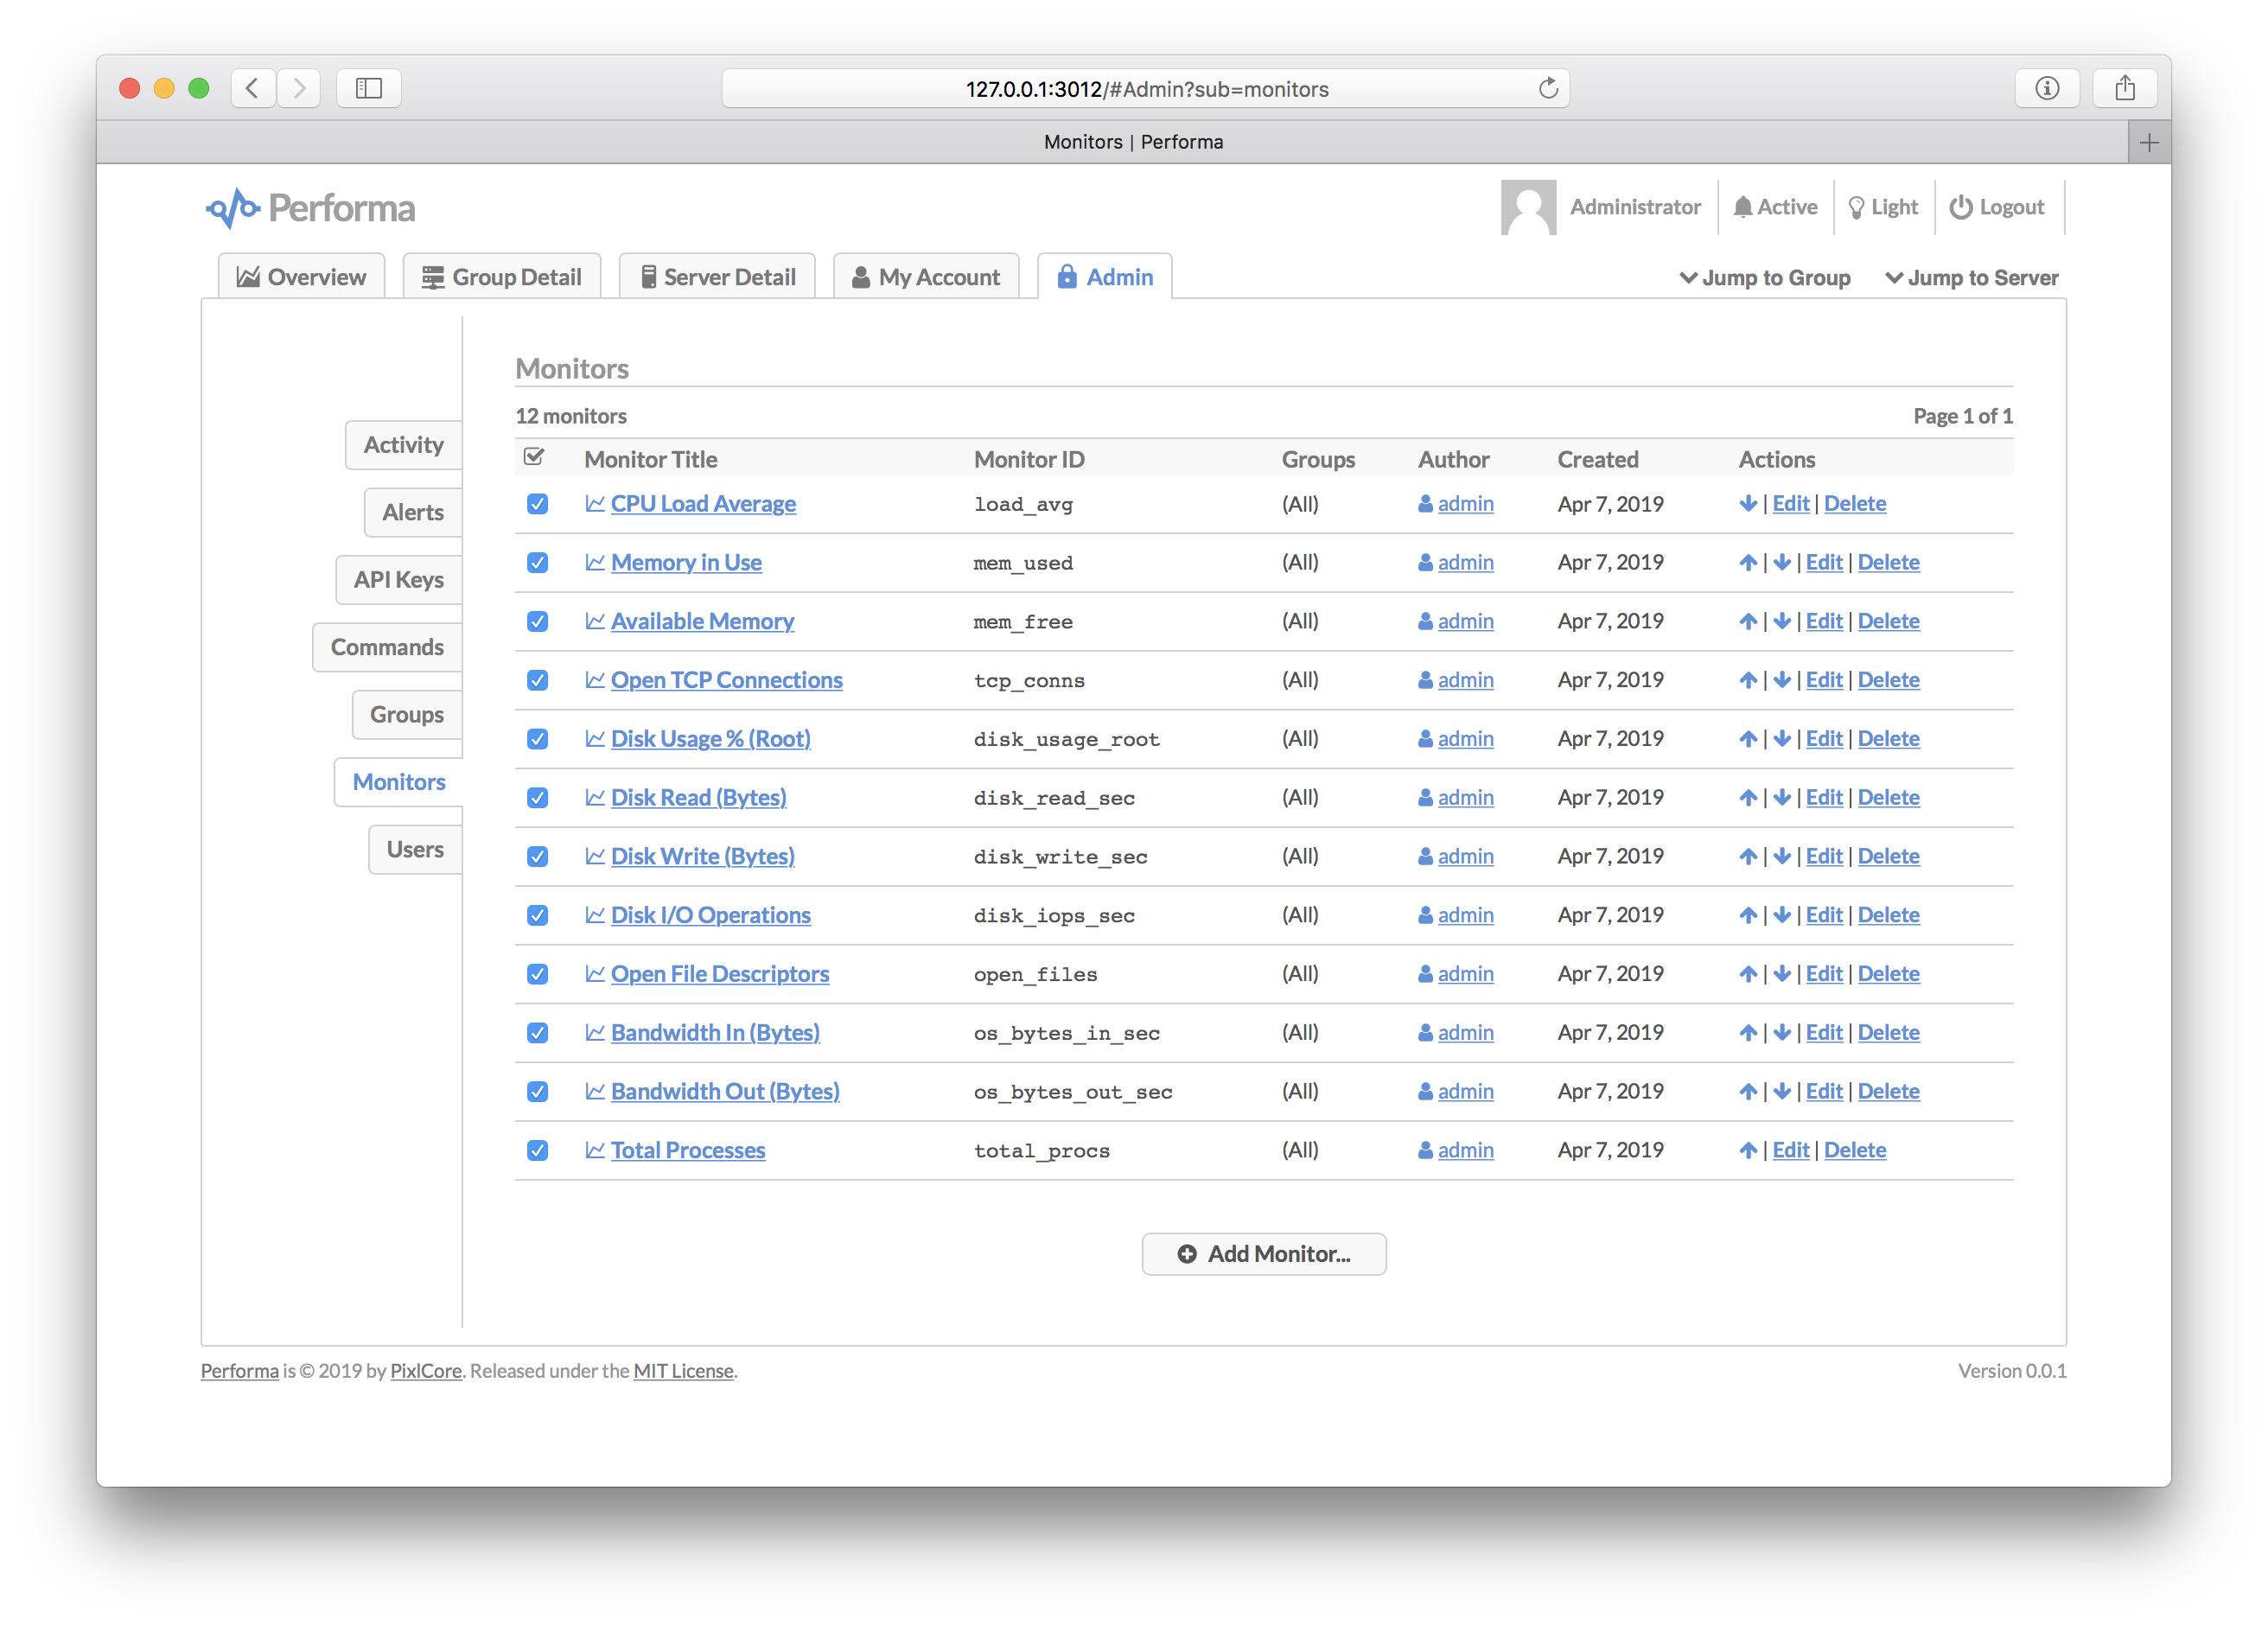
A monitor is a single graph, which plots a server metric (number) over time. Monitors can be assigned to one or more groups, are displayed on both the individual server and group pages, and optionally included on the main "Overview" page as well.
Each monitor has the following properties:
| Property | Description |
|---|---|
| ID | A unique alphanumeric ID for the monitor. |
| Title | A display title (label) for the monitor, shown in the UI. |
| Enabled | A checkbox denoting whether the monitor is enabled (displayed in the UI) or disabled (hidden). |
| Groups | A list of which server groups the monitor should be displayed for (or you can select "all" groups). |
| Data Source | Specify the data source path for the monitor. See Data Sources below. |
| Data Type | Select how the data value should be represented (i.e. integer, float, bytes). |
| Delta | A metric can optionally be interpreted as a delta from the last reading (useful for graphing counters). |
| Suffix | Optionally specify a suffix to be displayed after the data value, e.g. /sec. |
| Overview | Optionally include the monitor on the main Overview page. |
| Notes | A notes text field is provided for your own internal use. |
A monitor's "data source" points to the location of the data value to graph. Meaning, it points to a specific metric in the data stream submitted by each server. The syntax is [square/brackets/with/slashes]. Here is an example:
[stats/network/conns]
You can explore all the metrics and their locations in the data stream by using the Server Data Explorer, which is a tool provided in the UI on the monitor edit screen. Here is a screenshot:
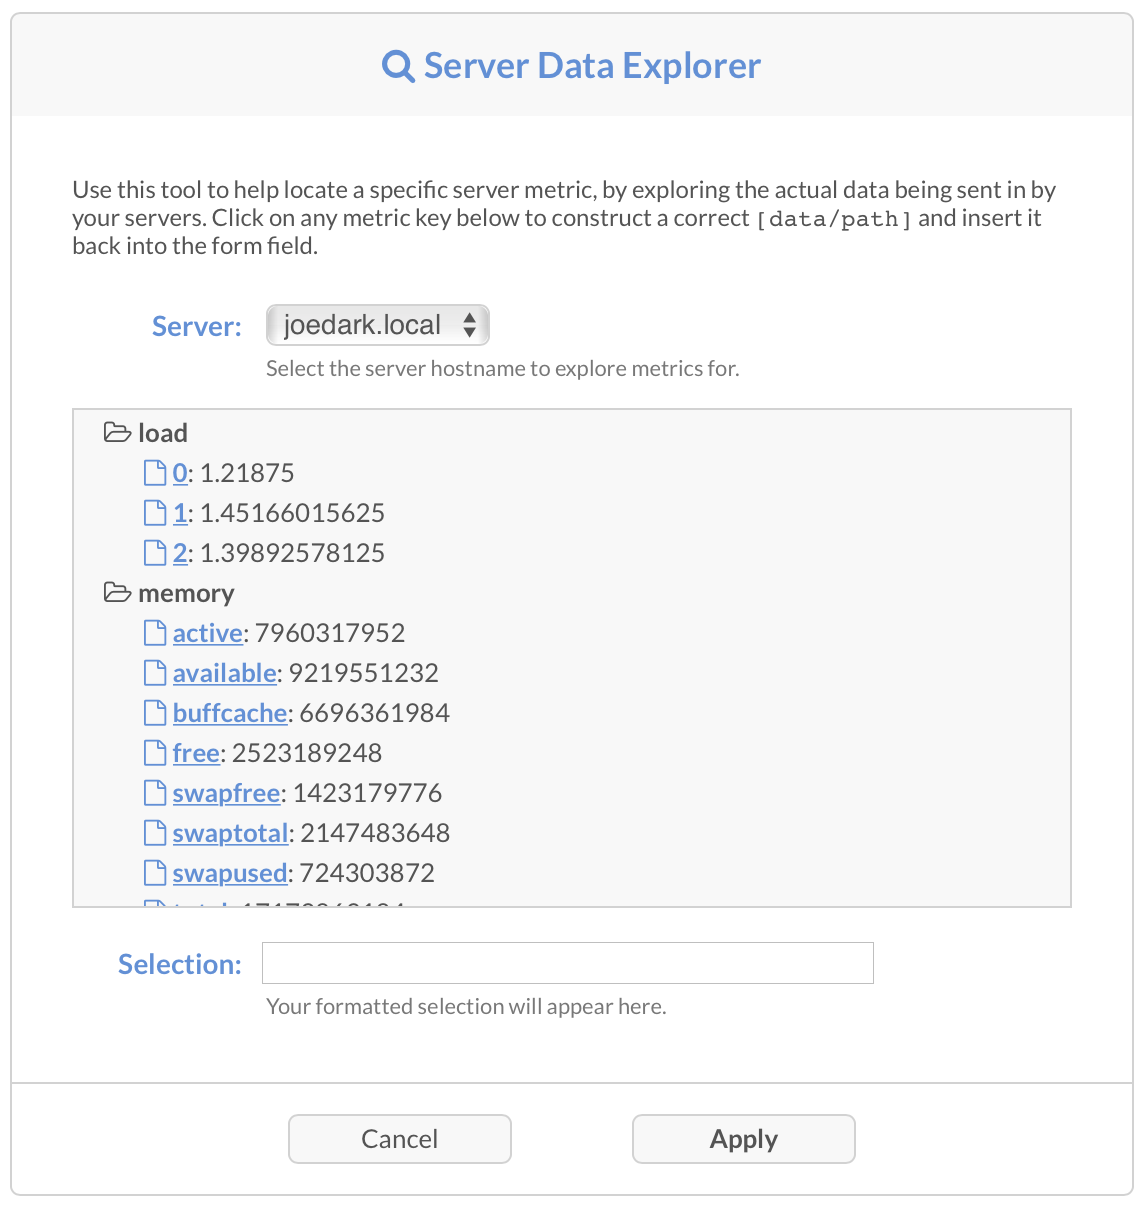
The idea here is that you can explore all the data submitted by any of your servers, and pick out the specific metric you want to graph. This will usually entail grabbing data values from your own custom Commands. Those are located under the commands/ prefix, and look like this:
[commands/open_files]
This would grab the data value from the open_files command, and assign it to the monitor for graphing. You can also combine multiple metrics together using mathematical operations. The entire data source text field is interpreted as an expression. Example:
[commands/my_stats/perf/read] + [commands/my_stats/perf/write]
This would grab both the perf/read and perf/write values from the my_stats command, add them together (+), and use the result for the actual monitor / graph value. This feature is also useful for adjusting the scale of a metric, i.e. multiplying or dividing by a constant, for e.g. to convert milliseconds to seconds, etc.
Performs ships with the following built-in monitors. You can of course change or delete these.
- CPU Load Average
- Memory in Use
- Available Memory
- Open TCP Connections
- Disk Usage % (Root)
- Disk Read (Bytes)
- Disk Write (Bytes)
- Disk I/O Operations
- CPU I/O Wait %
- Open File Descriptors
- Bandwidth In (Bytes)
- Bandwidth Out (Bytes)
- Total Processes
Alerts can notify you of potential problems with your servers, such as running low on memory, or the CPU load average running too high. These conditions are checked by evaluating a custom expression (see below), using the same syntax as monitor data sources. If the expression evaluates to true (and wasn't true before), then the alert fires, and can send e-mails and/or web hooks for notification. An alert is "cleared" when the expression no longer evaluates to true (this also sends a notification).
Each alert has the following properties:
| Property | Description |
|---|---|
| ID | A unique alphanumeric ID for the alert. |
| Title | A display title (label) for the alert, shown in the UI and notifications. |
| Enabled | A checkbox denoting whether notifications for the alert are enabled or disabled. |
| Groups | A list of which server groups the alert should apply to (or you can select "all" groups). |
| Expression | An expression to evaluate which triggers the alert. See Alert Expressions below. |
| Message | A message to display in notifications when the alert is triggered. |
| Overlay | Optionally overlay alerts on top of a specific monitor's graphs. |
| Optionally specify an e-mail address for notifications (falls back to group or global e-mail). | |
| Web Hook | Optionally specify a web hook URL for notifications (falls back to group, and always fires global). |
| Notes | A notes text field is provided for your own internal use. |
An alert expression is very similar to the data source syntax, in that you can use [square/bracket/with/slashes] syntax to compare any data value to any other value. For example:
[monitors/load_avg] >= ([cpu/cores] + 1)
This checks to see if the current CPU load average is equal to or above the number of CPU cores in the server, plus one. So if the server has 8 CPU cores, this alert would trigger if the load average reached 9.0. You can use any data metrics here, including those from your own commands.
Note: If you use any delta monitors for your alert expression, make sure you target the value in the [deltas/ object, not the [monitors/ object. The latter contains the raw absolute counter value (likely not what you want), whereas the former contains the computed delta value.
Alert messages may also use the [square/bracket/with/slashes] syntax as described in data sources above, but they also support a number of special prefixes for formatting data values for display. Example:
Less than 5% of total memory is available ([bytes:memory/available] of [bytes:memory/total])
In this example alert message, both the memory/available and memory/total values have a bytes: prefix. This interprets the value as a number of bytes, and converts the output to human-readable format (e.g. 4.5 MB). Here is a list of all the supported prefixes:
| Prefix | Description |
|---|---|
bytes: |
Interpret the value as bytes, and convert to a human-readable format, e.g. 3.1 GB. |
commify: |
Convert the number to an integer and apply US-style number formatting, e.g. commas every thousand. |
pct: |
Convert the number to a floating point decimal with no more than 2 digits after the decimal, and append a % symbol. |
integer: |
Convert the number to an integer (floor to nearest). |
float: |
Convert the number to a floating point decimal with no more than 2 digits after the decimal. |
Performs ships with the following built-in alerts. You can of course change or delete these.
| Alert Title | Expression |
|---|---|
| High CPU Load | [monitors/load_avg] >= ([cpu/cores] + 1) |
| Low Memory | [memory/available] < ([memory/total] * 0.05) |
| High I/O Wait | [monitors/io_wait] >= 75 |
| Disk Full | [monitors/disk_usage_root] >= 90 |
When an alert fires (and when it clears), you can configure a "web hook" to be sent. This is basically a custom URL which Performa requests using HTTP POST, and it sends along information about the alert event as JSON encoded data. Here is an example JSON payload (pretty-printed for display purposes):
{
	"action": "alert_new",
	"hostname": "dev001.local",
	"group": "main",
	"live_url": "http://localhost:5511/#Server?hostname=dev001.local",
	"snapshot_url": "http://localhost:5511/#Snapshot?id=dev001.local/832434",
	"alert": {
		"date": 1555377004,
		"exp": "11.34 >= 9",
		"message": "CPU load average is too high: 11.34 (8 CPU cores)"
	},
	"definition": {
		"id": "load_avg_high",
		"title": "High CPU Load",
		"expression": "[monitors/load_avg] >= ([cpu/cores] + 1)",
		"message": "CPU load average is too high: [float:monitors/load_avg] ([cpu/cores] CPU cores)",
		"group_match": ".+",
		"email": "",
		"web_hook": "http://my.notify.server.com/notify-me",
		"monitor_id": "load_avg",
		"enabled": true,
		"notes": "",
		"username": "admin",
		"modified": 1434125333,
		"created": 1434125333
	},
	"text": "Performa Alert: dev001.local: High CPU Load: CPU load average is too high: 11.34 (8 CPU cores) - ([View Details](http://localhost:5511/#Server?hostname=dev001.local))"
}
Here are descriptions of all the properties in the JSON web hook data:
| Property Name | Description |
|---|---|
action |
This denotes the event, will be alert_new when an alert triggers, and alert_cleared when an alert clears. |
hostname |
The server hostname where the alert event took place. |
group |
The Group ID which the server is assigned to (see Groups). |
live_url |
A fully-qualified URL to the live server view page, showing the latest real-time metrics. |
snapshot_url |
A fully-qualified URL to the snapshot page, showing detailed server information recorded at the time of the alert. |
alert |
An object containing internal metadata about the alert event. |
alert/date |
The exact date/time when the alert triggered, expressed in Epoch seconds. |
alert/exp |
The alert expression, with all macros substituted with actual values. |
alert/message |
The alert message text, with all macros substituted with actual values. |
definition |
An object containing information about the alert configuration. |
definition/id |
The unique ID for the alert. |
definition/title |
The title (display label) for the alert. |
definition/expression |
The expression source for the alert trigger. |
definition/message |
The message source for alert notifications. |
definition/group_match |
Denotes which groups the alert applies to (regular expression). |
definition/email |
The e-mail address configured for the alert. |
definition/web_hook |
The web hook URL configured for the alert. |
definition/monitor_id |
The monitor ID to display alert overlays on. |
definition/enabled |
Whether the alert is enabled (true) or disabled (false). |
definition/notes |
Optional notes about the alert (user defined). |
definition/username |
The username of the user who first created the alert. |
definition/modified |
The last modification date/time of the alert, in Epoch seconds. |
definition/created |
The initial creation date/time of the alert, in Epoch seconds. |
text |
A formatted text string describing the event (alert triggered or cleared). |
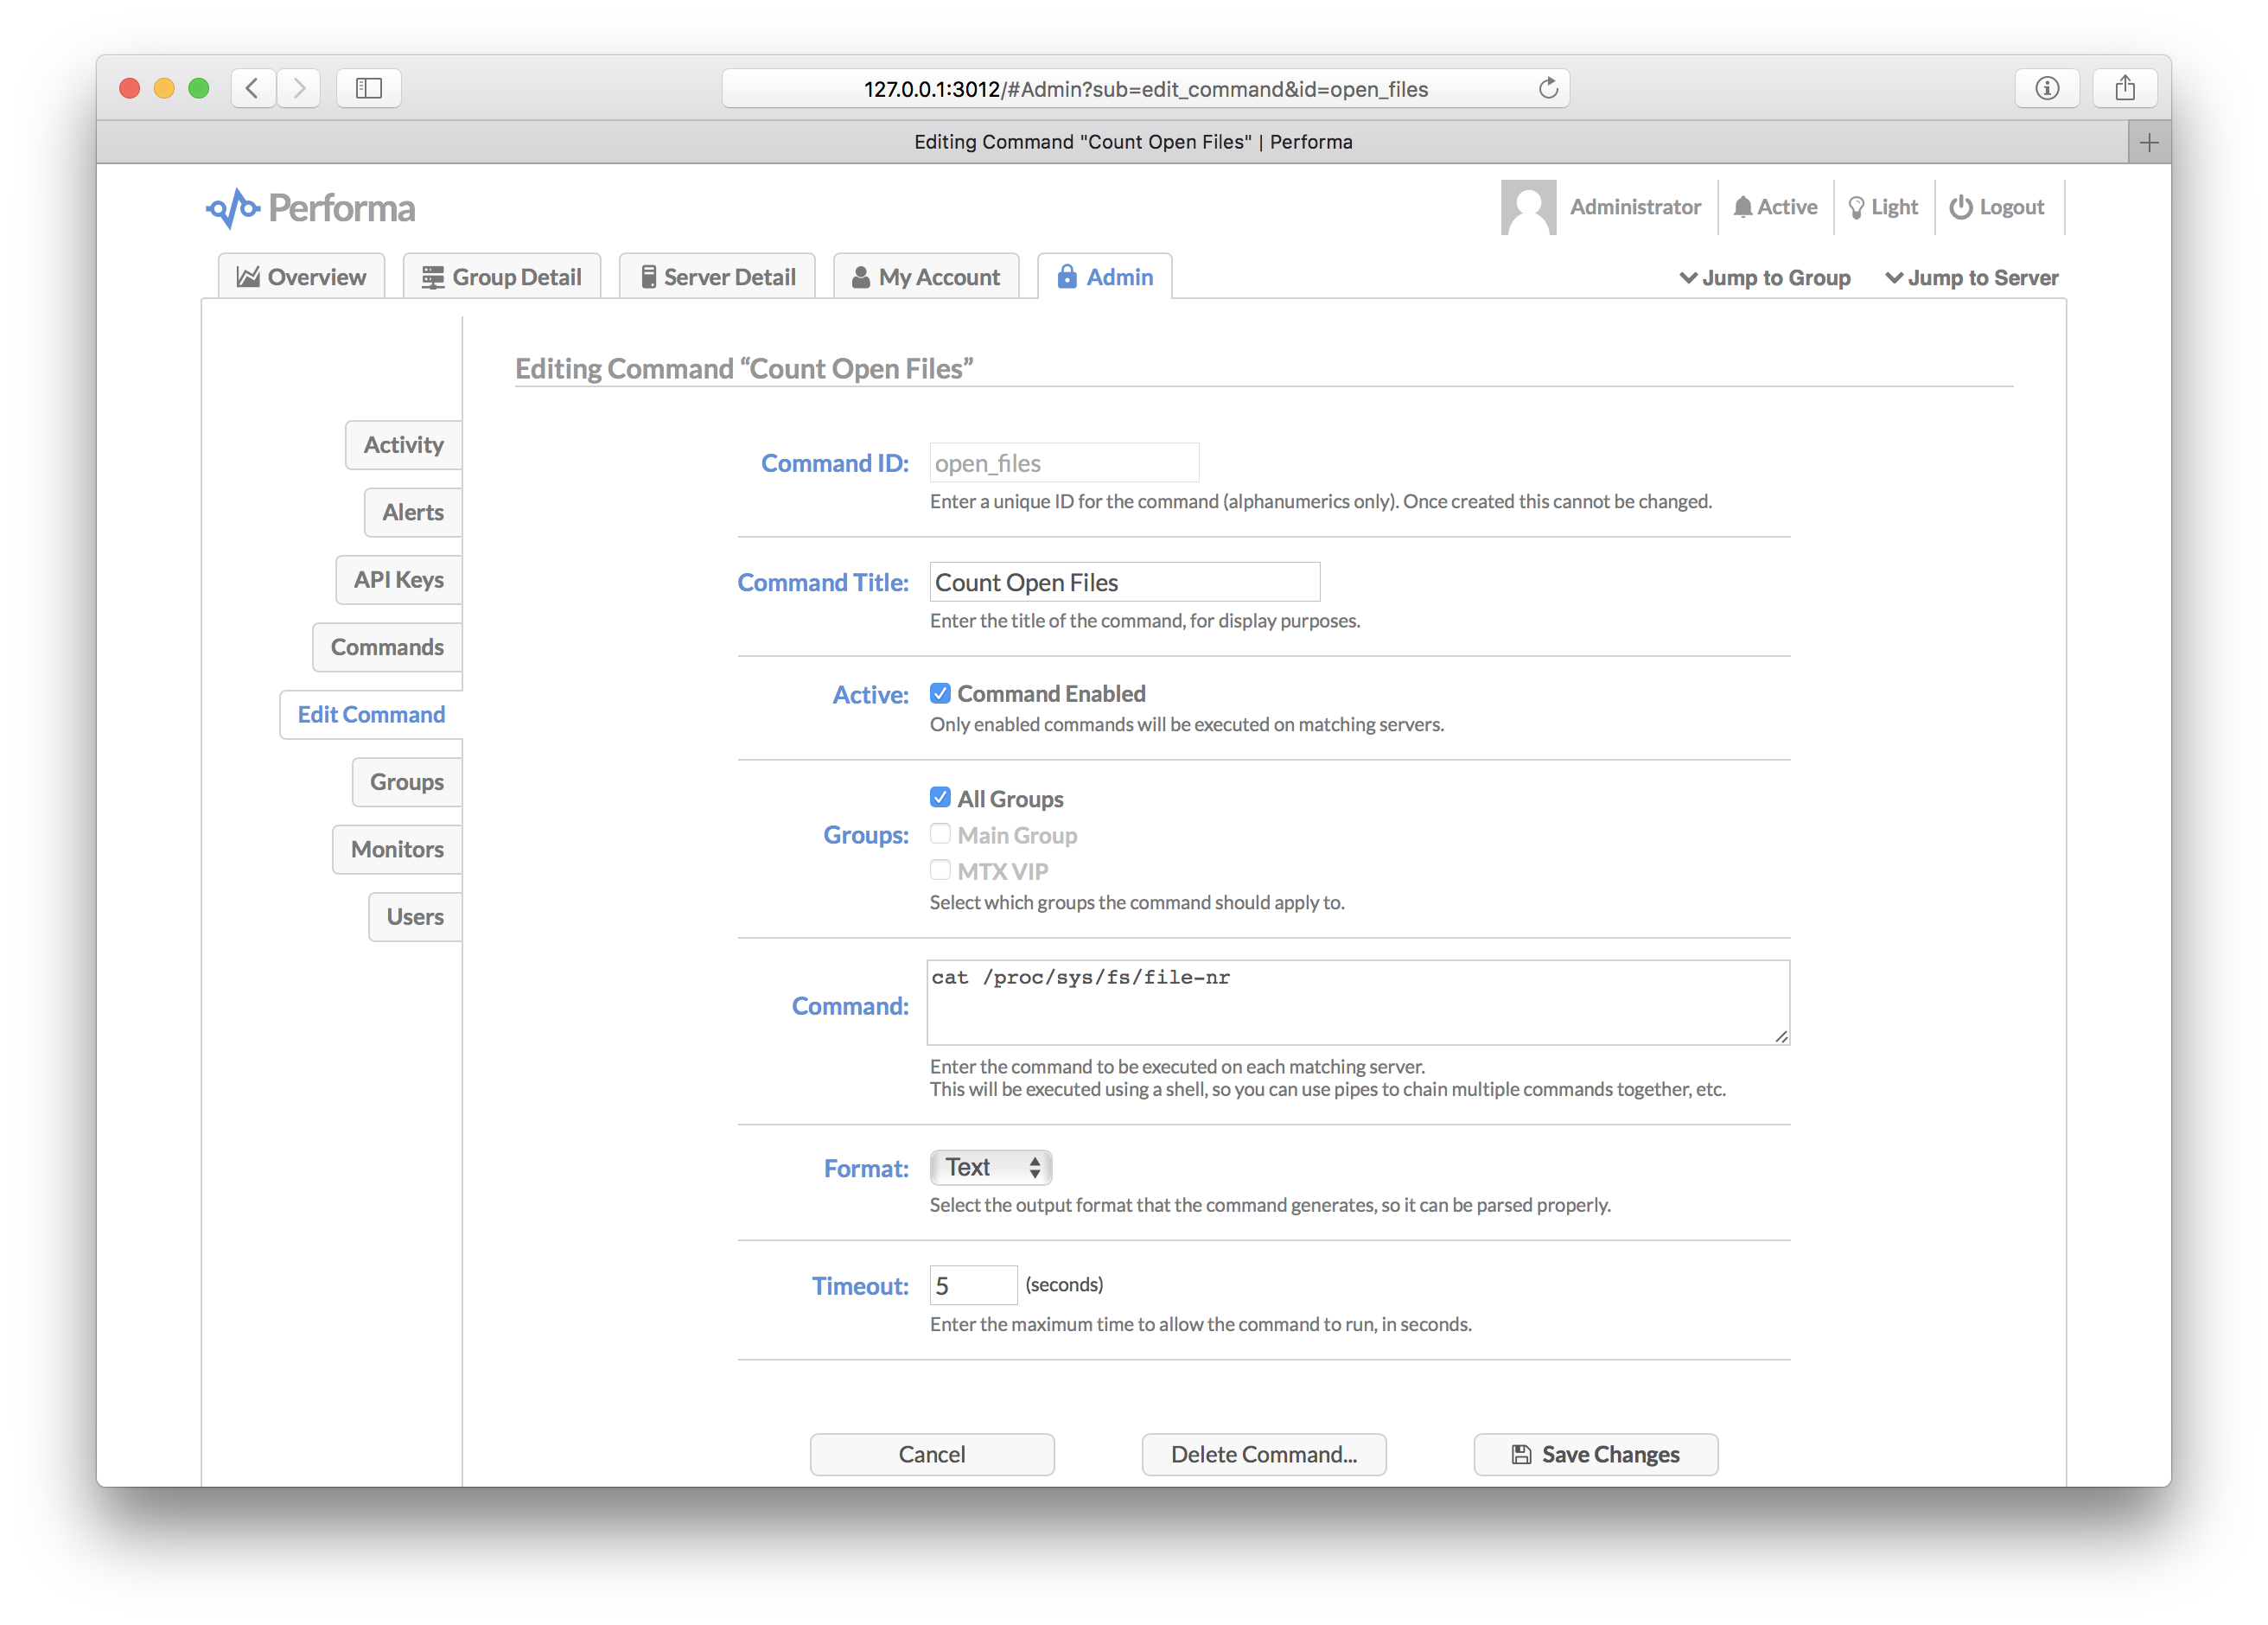
Performa collects a variety of metrics by default, including CPU, memory, disk and network stats, but you can extend this by executing your own custom commands. A command is an executable (e.g. /bin/sh) and a script which is piped into the executable (e.g. a shell script). Using this system you can collect your own data metrics on your servers, either by executing shell commands, or entering source code for an interpreter like Perl or Python.
Each command has the following properties:
| Property | Description |
|---|---|
| ID | A unique alphanumeric ID for the alert. |
| Title | A display title (label) for the alert, shown in the UI. |
| Enabled | A checkbox denoting whether the command is enabled (will be executed) or disabled (skipped). |
| Groups | A list of which server groups the command should be executed on (or you can select "all" groups). |
| Executable | The executable command to run (e.g. /bin/sh, /usr/bin/python or other). |
| Script | The script source code to pipe to the command (i.e. shell commands or other). |
| Format | If your command outputs JSON or XML, you can have this parsed for easier integration with monitors / alerts. |
| User ID | Optionally run your command as a different user on the server (i.e. for security purposes). |
| Notes | A notes text field is provided for your own internal use. |
If your command outputs raw text, you can use a regular expression to match the specific metric value (this is configured per each monitor that refers to the command). Or, if your command happens to output JSON or XML, then Performa can parse it, and provide more structured access in the Data Source system.
A snapshot is a detailed report of everything happening on a server, including all the information we collect every minute (i.e. CPU, memory stats), but also:
- A detailed list of all processes running on the server, including PIDs, commands, CPU and memory usage.
- A detailed list of all network connections, their source and destination IP addresses and ports, and each connection state.
- A list of all socket listeners, including which protocol, interface and port number.
- A list of all filesystem mounts and their usage and free space.
Performa automatically takes a snapshot of a server whenever any alert is triggered. This allows you to come back later to see exactly what was happening at the time of the alert (i.e. which processes and connections were open). You can access snapshots from the alert e-mail notification, as well as the "Snapshots" tab in the UI.
In addition to automatic snapshots, you can "watch" any server or group for any amount of time. Setting a "watch" on a server or group means that it will generate a snapshot every minute for the duration of the watch timer. You can set watches by clicking the "Watch Server..." or "Watch Group..." buttons in the UI.
Here are all the Performa services available to you on the command line. Most of these are accessed via the following shell script:
/opt/performa/bin/control.sh [COMMAND]
Here are all the accepted commands:
| Command | Description |
|---|---|
start |
Starts Performa in daemon mode. See Starting and Stopping. |
stop |
Stops the Performa daemon and waits for exit. See Starting and Stopping. |
restart |
Calls stop, then start, in sequence. See Starting and Stopping. |
status |
Checks whether Performa is currently running. See Starting and Stopping. |
setup |
Runs initial storage setup (for first time install). See Setup. |
maint |
Runs daily storage maintenance routine manually. See Storage Maintenance. |
admin |
Creates new emergency admin account (specify user / pass). See Recover Admin Access. |
export |
Exports data to specified file. See Data Import and Export. |
import |
Imports data from specified file. See Data Import and Export. |
upgrade |
Upgrades Performa to the latest stable (or specify version). See Upgrading. |
version |
Outputs the current Performa package version and exits. |
help |
Displays a list of available commands and exits. |
To start the service, use the start command:
/opt/performa/bin/control.sh start
And to stop it, the stop command:
/opt/performa/bin/control.sh stop
You can also issue a quick stop + start with the restart command:
/opt/performa/bin/control.sh restart
The status command will tell you if the service is running or not:
/opt/performa/bin/control.sh status
Storage maintenance automatically runs every morning at 4 AM local server time (this is configurable if you want to change it). The operation is mainly for deleting expired records, and pruning lists that have grown too large. However, if the Performa service was stopped and you missed a day or two, you can force it to run at any time. Just execute this command on your master server:
/opt/performa/bin/control.sh maint
This will run maintenance for the current day. However, if the service was down for more than one day, please run the command for each missed day, providing the date in YYYY-MM-DD format:
/opt/performa/bin/control.sh maint 2015-10-29
/opt/performa/bin/control.sh maint 2015-10-30
Lost access to your admin account? You can create a new temporary administrator account on the command-line. Just execute this command on your master server:
/opt/performa/bin/control.sh admin USERNAME PASSWORD
Replace USERNAME with the desired username, and PASSWORD with the desired password for the new account. Note that the new user will not show up in the master list of users in the UI. But you will be able to login using the provided credentials. This is more of an emergency operation, just to allow you to get back into the system. This is not a good way to create permanent users. Once you are logged back in, you should consider creating another account from the UI, then deleting the emergency admin account.
Here are the instructions for making Performa automatically start on server boot (Linux only). Type these commands as root:
cd /opt/performa
npm run boot
To upgrade Performa, you can use the built-in upgrade command:
/opt/performa/bin/control.sh upgrade
This will upgrade the app and all dependencies to the latest stable release, if a new one is available. It will not affect your data storage, users, or configuration settings. All those will be preserved and imported to the new version.
Alternately, you can specify the exact version you want to upgrade (or downgrade) to:
/opt/performa/bin/control.sh upgrade 1.0.4
If you upgrade to the HEAD version, this will grab the very latest from GitHub. Note that this is primarily for developers or beta-testers, and is likely going to contain bugs. Use at your own risk:
/opt/performa/bin/control.sh upgrade HEAD
Performa can import and export data via the command-line, to/from a plain text file. This data includes all the configuration storage records such as Users, API Keys, Groups, Monitors, Alerts, and Commands. It excludes things like timeline data.
To export your Performa data, issue this command on your master server:
/opt/performa/bin/control.sh export /path/to/performa-data-backup.txt --verbose
The --verbose flag makes it emit some extra information to the console. Omit that if you want it to run silently. Omit the filename if you want it to export the data to STDOUT instead of a file.
To import data back into the system, first make sure the Performa daemon is not running, and then run this command:
/opt/performa/bin/control.sh import /path/to/performa-data-backup.txt
If you want daily backups of the data which auto-expire after a year, a simple shell script can do it for ya:
#!/bin/bash
DATE_STAMP=`date "+%Y-%m-%d"`
BACKUP_DIR="/backup/performa/data"
BACKUP_FILE="$BACKUP_DIR/backup-$DATE_STAMP.txt"

mkdir -p $BACKUP_DIR
/opt/performa/bin/control.sh export $BACKUP_FILE --verbose
find $BACKUP_DIR -mtime +365 -type f -exec rm -v {} \;If you want to completely remove Performa from your server, all you have to do is stop the service (if it is running), remove the service from systemd boot (if you added it), and delete the base directory. Here are the commands:
cd /opt/performa
bin/control.sh stop
npm run unboot
cd ..
rm -rf performa
Note that if you configured your storage to live elsewhere on disk, or in Couchbase / S3, it must be deleted separately.
If you installed Performa Satellite on additional servers, see these instructions for removing it.
Performa writes its logs in a plain text, square-bracket delimited column format, which looks like this:
[1555279150.85][2019-04-14 14:59:10][joedark.local][59975][Performa][debug][1][Performa v1.0.0 Starting Up][{"pid":59975,"ppid":59969,"node":"v10.14.1","arch":"x64","platform":"darwin","argv":["/usr/local/bin/node","/Users/jhuckaby/git/performa/lib/main.js","--debug","--echo","Performa WebServer API Transaction Error","--color","debug"],"execArgv":["--trace-warnings"]}]
[1555279150.855][2019-04-14 14:59:10][joedark.local][59975][Performa][debug][9][Writing PID File: logs/performa.pid: 59975][]
[1555279150.859][2019-04-14 14:59:10][joedark.local][59975][Performa][debug][9][Confirmed PID File contents: logs/performa.pid: 59975][]
[1555279150.861][2019-04-14 14:59:10][joedark.local][59975][Performa][debug][2][Server IP: 192.168.3.23, Daemon PID: 59975][]
[1555279150.861][2019-04-14 14:59:10][joedark.local][59975][Performa][debug][3][Starting component: Storage][]
[1555279150.866][2019-04-14 14:59:10][joedark.local][59975][Performa][debug][3][Starting component: WebServer][]
[1555279150.866][2019-04-14 14:59:10][joedark.local][59975][WebServer][debug][2][pixl-server-web v1.1.18 starting up][]
[1555279150.868][2019-04-14 14:59:10][joedark.local][59975][WebServer][debug][2][Starting HTTP server on port: 5511][]
[1555279150.871][2019-04-14 14:59:10][joedark.local][59975][WebServer][debug][3][Now listening for HTTP connections][{"address":"::","family":"IPv6","port":5511}]
[1555279150.871][2019-04-14 14:59:10][joedark.local][59975][Performa][debug][3][Starting component: API][]
[1555279150.872][2019-04-14 14:59:10][joedark.local][59975][API][debug][3][API service listening for base URI: /api][]
[1555279150.872][2019-04-14 14:59:10][joedark.local][59975][WebServer][debug][3][Adding custom URI handler: /\/api\/(\w+)/: API][]
[1555279150.872][2019-04-14 14:59:10][joedark.local][59975][Performa][debug][3][Starting component: User][]
[1555279150.873][2019-04-14 14:59:10][joedark.local][59975][API][debug][3][Adding API namespace: user][]
[1555279150.873][2019-04-14 14:59:10][joedark.local][59975][Performa][debug][3][Starting component: Performa][]
[1555279150.873][2019-04-14 14:59:10][joedark.local][59975][Performa][debug][3][Performa engine starting up][["/usr/local/bin/node","/Users/jhuckaby/git/performa/lib/main.js","--debug","--echo","Performa WebServer API Transaction Error","--color","debug"]]
[1555279150.874][2019-04-14 14:59:10][joedark.local][59975][API][debug][3][Adding API namespace: app][]
[1555279150.874][2019-04-14 14:59:10][joedark.local][59975][WebServer][debug][3][Adding custom URI handler: /^\/files/: File][]
[1555279150.874][2019-04-14 14:59:10][joedark.local][59975][WebServer][debug][3][Adding custom request method handler: OPTIONS: CORS Preflight][]
[1555279150.888][2019-04-14 14:59:10][joedark.local][59975][Performa][debug][2][Startup complete, entering main loop][]
The log columns are defined as follows, from left to right:
| Log Column | Description |
|---|---|
hires_epoch |
A date/time stamp in high-resolution Epoch time. |
date |
A human-readable date/time stamp in the format: YYYY/MM/DD HH:MI:SS (local server time) |
hostname |
The hostname of the server that wrote the log entry (useful for multi-server setups if you merge your logs together). |
pid |
The PID (Process ID) of the process that logged the event. |
component |
The component name which generated the log entry. See below for a list of all the components. |
category |
The category of the log entry, which will be one of debug, transaction or error. |
code |
Debug level (1 to 10), transaction or error code. |
msg |
Debug, transaction or error message text. |
data |
Additional JSON data, may or may not present. |
The columns are configurable via the log_columns property in the conf/config.json file:
{
	"log_columns": ["hires_epoch", "date", "hostname", "pid", "component", "category", "code", "msg", "data"]
}
Feel free to reorder or remove columns, but don't rename any. The IDs are special, and match up to keywords in the source code.
By default, logging consists of several different files, each for a specific component of the system. After starting up Performa, you will find these log files in the log_dir directory:
| Log Filename | Description |
|---|---|
Performa.log |
The main component will contain most of the app logic. |
Error.log |
The error log will contain all application errors. |
Transaction.log |
The transaction log will contain all transactions. |
API.log |
The API component log will contain information about incoming HTTP API calls. |
Storage.log |
The storage component log will contain information about data reads and writes. |
Filesystem.log |
Only applicable if you use the local filesystem storage back-end. |
Couchbase.log |
Only applicable if you use the Couchbase storage back-end. |
S3.log |
Only applicable if you use the Amazon S3 storage back-end. |
User.log |
The user component log will contain user related information such as logins and logouts. |
WebServer.log |
The web server component log will contain information about HTTP requests and connections. |
crash.log |
If Performa crashed for any reason, you should find a date/time and stack trace in this log. |
install.log |
Contains detailed installation notes from npm, and the build script. |
The log_filename configuration property controls this, and by default it is set to the following:
{
	"log_filename": "[component].log",
}
This causes the value of the component column to dictate the actual log filename. If you would prefer that everything be logged to a single combo file instead, just change this to a normal string without brackets, such as:
{
	"log_filename": "event.log",
}Performa runs as a component in the pixl-server framework. It is highly recommended to read and understand that module and its component system before attempting to develop Performa. The following server components are also used:
| Module Name | Description | License |
|---|---|---|
| pixl-server-api | A JSON API component for the pixl-server framework. | MIT |
| pixl-server-storage | A key/value/list storage component for the pixl-server framework. | MIT |
| pixl-server-user | A basic user login system for the pixl-server framework. | MIT |
| pixl-server-web | A web server component for the pixl-server framework. | MIT |
In addition, Performa uses the following server-side PixlCore utility modules:
| Module Name | Description | License |
|---|---|---|
| pixl-args | A simple module for parsing command line arguments. | MIT |
| pixl-class | A simple module for creating classes, with inheritance and mixins. | MIT |
| pixl-config | A simple JSON configuration loader. | MIT |
| pixl-json-stream | Provides an easy API for sending and receiving JSON records over standard streams (pipes or sockets). | MIT |
| pixl-logger | A simple logging class which generates bracket delimited log columns. | MIT |
| pixl-mail | A very simple class for sending e-mail via SMTP. | MIT |
| pixl-perf | A simple, high precision performance tracking system. | MIT |
| pixl-request | A very simple module for making HTTP requests. | MIT |
| pixl-tools | A set of miscellaneous utility functions for Node.js. | MIT |
| pixl-unit | A very simple unit test runner for Node.js. | MIT |
For the client-side, the Performa web application is built on the pixl-webapp HTML5/CSS/JavaScript framework:
| Module Name | Description | License |
|---|---|---|
| pixl-webapp | A client-side JavaScript framework, designed to be a base for web applications. | MIT |
Here is how you can download the very latest Performa dev build and install it manually (may contain bugs!):
git clone https://github.com/jhuckaby/performa.git
cd performa
npm install
node bin/build.js dev
This will keep all JavaScript and CSS unobfuscated (original source served as separate files).
I highly recommend placing the following .gitignore file at the base of the project, if you plan on committing changes and sending pull requests:
.gitignore
/node_modules
/work
/logs
/data
/conf
htdocs/index.html
htdocs/js/common
htdocs/js/external/*
htdocs/fonts/*
htdocs/css/base.css
htdocs/css/font*
htdocs/css/mat*
To start Performa in debug mode, issue the following command:
./bin/control.sh debug
This will launch the service without forking a daemon process, and echo the entire debug log contents to the console. This is great for debugging server-side issues. Beware of file permissions if you run as a non-root user. Hit Ctrl-C to shut down the service when in this mode.
The MIT License (MIT)
Copyright (c) 2019 Joseph Huckaby
Permission is hereby granted, free of charge, to any person obtaining a copy of this software and associated documentation files (the "Software"), to deal in the Software without restriction, including without limitation the rights to use, copy, modify, merge, publish, distribute, sublicense, and/or sell copies of the Software, and to permit persons to whom the Software is furnished to do so, subject to the following conditions:
The above copyright notice and this permission notice shall be included in all copies or substantial portions of the Software.
THE SOFTWARE IS PROVIDED "AS IS", WITHOUT WARRANTY OF ANY KIND, EXPRESS OR IMPLIED, INCLUDING BUT NOT LIMITED TO THE WARRANTIES OF MERCHANTABILITY, FITNESS FOR A PARTICULAR PURPOSE AND NONINFRINGEMENT. IN NO EVENT SHALL THE AUTHORS OR COPYRIGHT HOLDERS BE LIABLE FOR ANY CLAIM, DAMAGES OR OTHER LIABILITY, WHETHER IN AN ACTION OF CONTRACT, TORT OR OTHERWISE, ARISING FROM, OUT OF OR IN CONNECTION WITH THE SOFTWARE OR THE USE OR OTHER DEALINGS IN THE SOFTWARE.