This PHP scripts are used to parse the output images of the ZebraLab tool to identify moving zones of the animals.
To use this tool one needs the following software:
- A webserver with the following modules enabled: PHP, Imagick-Library
- You should set the script execution timeout within your php.ini to a much higher value than the default 30 seconds. One image requires between 2 and 6 seconds to be processed. Batch execution with 100 images of 12 well plate normally takes up to 600 seconds, 100 images of 96 well plate up to 300 seconds.
- Copy all php files and the three folders Data, Work and __Olds to a directory within your webservers documents folder (like /var/www/html/Picalyzer).
- The webserver must have read and write access to those three folders.
Make sure that the following prerequisites have been fulfilled:
- Only 12-, 24- and 96- well plates are supported. 6 and 48 should also work but could not be tested right now.
Inside the Data folder, create a subfolder for running this test. Put all the ZebraLab tracking images into this folder. Now navigate to the Picalyzer website on your webserver (like http://localhost/Picalyzer/). If everything is fine you should see a simple list with the names of all of the folders inside the Data directory. After you click on one of the links to the subfolders, the script starts running. Don't interrupt it, as it could take a lot of time, depending on the number of images inside the directory. Once it's done, you get the result of the analyzation process.
To get animals grouped you must append &Groups=["Control":1:2;"25mg":3:4;"50mg":5:6] to the analyzing process url like http://localhost/Picalyzer/analyze.php?Folder=test&Groups=["Control":1:2;"25mg":3:4;"50mg":5:6]. The syntax is always:
- &Groups= - To tell the script, that the groups definition is coming next.
- [ - opening bracket
- As often as needed, separated by semicolon:
- "Groupname": - Your name for the group in quotation marks followed by colon
- 1:2 - The start end end column for this group. On a 24 well plate you have 6 columns (1...6), so 1:2 means the first to columns of the plate.
- ] - closing bracket.
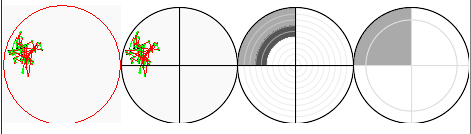
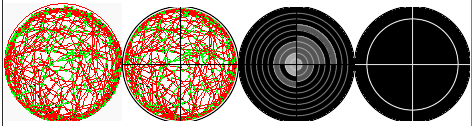
On the results page you will have 4 pictures for each source picture.
- The left one is the same as the source picture but cropped to the borders of the red tracking circle.
- The second one is the working copy of the first image and that cropped by white borders with the black circle and cross placed on top.
- The third picture shows you the activity zones where the fish swum. It's fragmented into the four directions (top left, top right, bottom right, bottom left) and ten circles of same size. Every zone get's filled by an activity color code (see below).
- The last image is a simplified version of third picture with only two distance zones.
The animals activity level in the output images and data is emphasized by four different colors. Internally they are represented by numbers.
- 0 = White (#FFFFFF) - (Almost) no activity
- 1 = Light Gray (#AAAAAA) - Activity with low speed or low activity with high speed
- 2 = Dark Gray (#555555) - Medium activity (a mix of fast and slow movement)
- 3 = Black (#000000) - High activity with fast movement


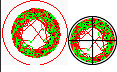 As the defined detection radius in ZebraLab does not always match the real well borders large white areas around the animals tracked movement can appear (see left pattern). The script tries to get to the real movement zone (right pattern) as close as possible. Therefore the following rules have been implemented:
- From 8 directions (top center, top right, center right, bottom right, bottom center, bottom left, center left, top left) it moves towards the pictures center as long as:
- A colored pixel (red, green or black) has been found and also :
- the pixel behind is also colored
- the pixel in front is also colored
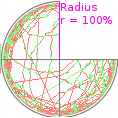
- the relative distance to the center is less then 98% (100% = half height of the picture)
- or the relative distance to the center is less then 60% (100% = half height of the picture) -> If this occurs, detection is failed.
- If one of the eight directions failed, then nothing will be changed and the detection is done.
- If none of the directions fails, the next step will be executed. For the detected colored pixels of the four directions (top center, center right, bottom center, center left) the script will compare their X (left/right) or Y (top/bottom) coordinate with their direct neighbor (Y of top center will be compared with Y of top left and top right). If this point is closer to the center of the picture than the average of all three values, it will be moved outside.
- After that, the working copy of the image is cropped to match the new coordinates. This image of the working copy will be the second result picture of the output data.
To collect all movement data from the images, the script will run the following procedure:
- Detect the RGB color, the coordinates, the direction from center and the distance to the center of every pixel of the image. Whenever distance is used it means the relative distance to the center of the image on a straight line while the radius of the image equals 100%.
- If the distance is larger than 99% (corners of the image outside the circle), nothing happens.
- For every distance level ([0...9] = 0-9%, 10-19%, ...) and the four directions (top right, bottom right, bottom left, top left) the following counters exits:
- Black
- Green
- Red
- White
- Empty
- NotEmpty
- Moving
- NotMoving
- Total
- ... and will be raised depending on the RGB color of the pixel:
- Black pixel:
- Black + 1
- NotEmpty + 1
- NotMoving + 1
- Total + 1
- Green pixel:
- Green + 1
- NotEmpty + 1
- Moving + 1
- Total + 1
- Red pixel:
- Red + 1
- NotEmpty + 1
- NotMoving + 1
- Total + 1
- White pixel:
- White + 1
- Empty + 1
- NotMoving + 1
- Total + 1
- If any pixel inside the circle has been registered this way, the activity level gets calculated for each distance level and directions. The first matching rule of the following ruleset is applied (see Resulting activity levels for the level identifiers).
- If no colored pixel has been found, then activity level 0.
- If black (inactive) is greater than the sum of green and red, then activity level 0.
- If empty is more than 90% of total, then activity 0.
- If slow movement (green) and fast movement (red) are both above 33% of NotEmpty, then activity level 2.
- If green is greater than red, then activity level 1.
- Activity level 3.
- If the activity level is 1 or higher the following rules will be applied:
- If NotEmpty is less then 20% of Total, then activity level = activity level - 2.
- Else If NotEmpty is less then 40% of Total, then activity level = activity level - 1.
- If activity level is below 1, then activity level is set to 1.
- Now as we have the activity level for all 40 zones (10 distance levels * 4 directions), it's time to calculate the activity levels for the simplified pattern:
- For the four directions in the inner zone the activity level is the weighted arithmetic median of the seven (96 well plate) / eight (other well plates) distance levels of the same direction.
- For the four directions in the outer zone the activity level is the weighted arithmetic median of the three (96 well plate) / two (other well plates) distance levels of the same direction.
After all calculations, the images gets drawn into the Work directory and displayed on the website. A copy of all data, including the website, is copied to the __Olds directory where you can find all your old data and pictures so there's no need to rerun the same images a second time.