- ✨ vscode-PowerShell #1880 - Move to date-based versioning
- ✨ vscode-PowerShell #1954 - Allow passing runspace name
- ✨ vscode-PowerShell #1945 - Edit snippets to support $TM_SELECTED_TEXT (Thanks @travis-c-lagrone!)
- 👷 vscode-PowerShell #1942 - Stop supporting 6.0
- ✨ vscode-PowerShell #1928 - Add RunCode command for CodeLens providers
- 🐛 vscode-PowerShell #1927 - Fix change session by moving to async/await promise
- 🐛 vscode-PowerShell #1931 - Fix upload bug report
- 🐛 vscode-PowerShell #1925 - Fix error in HtmlContentView.ShowContent when no JS/CSS provided (Thanks @rkeithhill!)
- 🐛 vscode-PowerShell #1919 - Fix CustomViews by switching to WebViews
- 🐛 vscode-PowerShell #1922 - Fix small typo in Function-Inline description (Thanks @V-ed!)
- ✨ vscode-PowerShell #1908 - Add PowerShell version telemetry
- 📖 vscode-PowerShell #1900 - Small update to Azure Data Studio marketplace README (Thanks @SQLvariant!)
- 💻 vscode-PowerShell #1871 - Change CI to use Azure Pipelines
- 🐛 vscode-PowerShell #1867 - Change whitespace settings to camelCase
- 🐛 vscode-PowerShell #1852 -
Turn
powershell.codeformatting.useCorrectCasingsetting off by default until PSScriptAnalyzer issues are fixed (Thanks @bergmeister!) - 🐛 vscode-powershell #1822 - Set featureFlag default to null so that it can be resolved by settings
- 💻 vscode-PowerShell #1839 - Add initial credscan config ymls for CI
- 🐛 vscode-PowerShell #1837 - Don't use -EncodedCommand to start PowerShell on Windows
- 🐛 vscode-PowerShell #1825 - Switch to current lowercase names for powershell and mdlint extensions (Thanks @rkeithhill!)
- 👷 vscode-PowerShell #1823 - Update to official TSLint extension in extensions.json, old version deprecated (Thanks @rkeithhill!)
- ✨ PowerShellEditorServices #951 - Allow passing RunspaceName
- 🚨 PowerShellEditorServices #944 - Add integration testing module with simple tests to verify PSES starts and stops
- 🐛 PowerShellEditorServices #954 - Ensure NamedPipeServerStream is assigned in Windows PowerShell
- ✨ PowerShellEditorServices #952 - Update to PSReadLine 2.0.0-beta4
- ✨ PowerShellEditorServices #877 - Add filtering for CodeLens and References (Thanks @glennsarti!)
- 🐛 vscode-powershell #1933 - Stop crash when workspace doesn't exist
- 👷 PowerShellEditorServices #878 - Remove native named pipes implementation
- 🐛 PowerShellEditorServices #947 - Fix silent failure in VSCode WebViews by using Id for dictionary since multiple pages could have the same title
- 🐛 PowerShellEditorServices #946 - Rename to use async
- 👷 PowerShellEditorServices #943 - Improvements to the log parsing module (Thanks @rkeithhill!)
- 💻 PowerShellEditorServices #921 - Set up CI with Azure Pipelines
- 🐛 PowerShellEditorServices #908 - Fix issue with reference code lens not working with UNC paths (Thanks @rkeithhill!)
- 🐛 vscode-powershell #1571 - Fix faulty netfx check
- 🐛 PowerShellEditorServices #906 - Fix New-EditorFile with no folder or no files open
- ✨ vscode-powershell #1398 - Improve path auto-completion (Thanks @rkeithhill!)
- 🐛 PowerShellEditorServices #910 -
Fix UseCorrectCasing to be actually configurable via
powershell.codeFormatting.useCorrectCasing(Thanks @bergmeister!) - 👷 PowerShellEditorServices #909 - Use global.json to pin .Net Core SDK version and update it from 2.1.402 to 2.1.602 (Thanks @bergmeister!)
- 👷 PowerShellEditorServices #903 - Move temp folder into repo to avoid state that causes build errors from time to time when rebuilding locally (and packages have updated) (Thanks @bergmeister!)
- 💻 PowerShellEditorServices #904 - Add initial credscan configuation ymls for CI
- 🐛 PowerShellEditorServices #901 - Switch to current lowercase names for powershell and mdlint exts (Thanks @rkeithhill!)
- vscode-PowerShell #1865 -
Change casing of
powershell.codeformattingsettings for consistency:powershell.codeformatting.WhitespaceInsideBraceis nowpowershell.codeformatting.whitespaceInsideBracepowershell.codeformatting.WhitespaceAroundPipeis nowpowershell.codeformatting.whitespaceAroundPipe
- vscode-PowerShell #1852 -
Turn
powershell.codeformatting.useCorrectCasingsetting off by default until PSSA issues are fixed (Thanks @bergmeister!) - vscode-PowerShell #1838 - Set PSReadLine featureFlag default to null so that it can be resolved by settings
- vscode-PowerShell #1837 - Do not use -EncodedCommand on Windows
- vscode-PowerShell #1825 - Switch to current lowercase names for powershell and mdlint recommended extensions (Thanks @rkeithhill!)
- vscode-PowerShell #1823 - Update to official TSLint ext in extensions.json, old version deprecated (Thanks @rkeithhill!)
- PowerShellEditorServices #902 - Improve path auto-completion (Thanks @rkeithhill!)
- PowerShellEditorServices #910 -
Fix UseCorrectCasing to be actually configurable via
powershell.codeFormatting.useCorrectCasing(Thanks @bergmeister!) - PowerShellEditorServices #909 - Use global.json to pin .Net Core SDK version and update it from 2.1.402 to 2.1.602 (Thanks @bergmeister!)
- PowerShellEditorServices #903 - Move temp folder into repo to avoid state that causes build errors from time to time when rebuilding locally (and packages have updated) (Thanks @bergmeister!)
Write-Progresswork in the integrated console ⏰- Support for PSScriptAnalyzer 1.18 📝
- The ability to debug any runspace in any process 🔎
- PSReadLine enabled by default on Windows 🎨
- (Bug fix!) You can open untitled workspaces/folders again! 🐛☠️
There are a lot more goodies in this version. Checkout the changelog below!
- vscode-PowerShell #1794 - Make PSReadLine default on Windows
- vscode-PowerShell #1736 - Enable attach to process on Linux and macOS
- vscode-PowerShell #1729 - Handle Pester Describe block strings with single quotes inside it (Thanks @bergmeister!)
- vscode-PowerShell #1741 - Update build to clear node modules directory (Thanks @corbob!)
- vscode-PowerShell #1743 - Fix right-click help lookup not always working (Thanks @corbob!)
- vscode-PowerShell #1746 - Add label property to debug config, change pkg name to lowercase (Thanks @rkeithhill!)
- vscode-PowerShell #1749 - Add the Install-VSCode.ps1 script to signing
- vscode-PowerShell #1747 -
Modify
powerShellDefaultVersiondescription to make clearer (Thanks @rkeithhill!) - vscode-PowerShell #1755 - Speed up Travis builds by skipping the .NET Core initialization (Thanks @bergmeister!)
- vscode-PowerShell #1773 -
Change debugger type field back to
PowerShellfrompowershell(Thanks @rkeithhill!) - vscode-PowerShell #1757 - Match Install-VSCode.ps1 script url with the one from master branch (Thanks @rafaltra!)
- vscode-PowerShell #1774 -
Switch to
EncodedCommandfor script execution - vscode-PowerShell #1764 - Added Pester, ShouldProcess and Calculated Property PS Snippets (Thanks @brettmillerb!)
- vscode-PowerShell #1776 - Migrate Pester version detection into an InovkePester stub script (Thanks @rkeithhill!)
- vscode-PowerShell #1781 - Fix initial launch config casing
- vscode-PowerShell #1775 -
Support
-CustomPipeName, allowing configuration of custom namedpipes for LSP transport - vscode-PowerShell #1787 - Added SQL PowerShell Examples (Thanks @SQLvariant!)
- vscode-PowerShell #1782 - Add Debug Runspace command (Thanks @adamdriscoll!)
- vscode-PowerShell #1800 - Include current runspace and runspace ID 1 in the PSHostProcess picker dialog
- vscode-PowerShell #1687 -
Add new
powershell.useCorrectCasingsettingsfor new rule in PSSA 1.18: PSUseCorrectCasing (Thanks @bergmeister!) - vscode-PowerShell #1668 -
Add new
powershell.codeFormattingsettings for new options in PSSA 1.18: WhitespaceInsideBrace and WhitespaceAroundPipe (Thanks @bergmeister!) - vscode-PowerShell #1669 -
Add new
powershell.codeFormattingsettings for new options in PSSA 1.18: PipelineIndentationStyle (Thanks @bergmeister!) - vscode-PowerShell #1738 - Set CommandExplorer exclusion filter to be empty array by default (Thanks @adilio!)
- vscode-PowerShell #1686 - Add an exclusion filter to the Command Explorer (Thanks @corbob!)
- vscode-PowerShell #1816 - Workaround PSSA #1187 by defaulting to NoIndentation
- PowerShellEditorServices #895 - Add warning to parameter validation set (Thanks @Benny1007!)
- PowerShellEditorServices #897 - Clean up and pop dead runspaces when using 'attach' debugging
- PowerShellEditorServices #888 - Add new ParseError level to ScriptFileMarkerLevel and filter out PSSA parse errors
- PowerShellEditorServices #858 - Fix XUnit warnings that better assertion operators should be used. (Thanks @bergmeister!)
- PowerShellEditorServices #854 - Reinstate test filtering (Thanks @glennsarti!)
- PowerShellEditorServices #866 - Catch NotSupportedException which can be thrown by FileStream constructor (Thanks @rkeithhill!)
- PowerShellEditorServices #868 - Speed up Travis builds by skipping the .NET Core initialization (Thanks @bergmeister!)
- PowerShellEditorServices #869 -
Added
AsNewFileswitch to Out-CurrentFile (Thanks @dfinke!) - PowerShellEditorServices #873 - Return the start line number for Describe block (Thanks @rkeithhill!)
- PowerShellEditorServices #876 - Temporarily disable deemphasized stack frames to fix VSCode issue 1750 (Thanks @rkeithhill!)
- PowerShellEditorServices #871 - Support -CustomPipeName, allowing configuration of custom namedpipes for LSP transport
- PowerShellEditorServices #872 - Fix unable to open files in problems/peek windows issue (Thanks @rkeithhill!)
- PowerShellEditorServices #875 - Add attach to local runspace. (Thanks @adamdriscoll!)
- PowerShellEditorServices #881 -
Use
NamedPipeConnectionInfoto connect to remote runspaces instead of Enter-PSHostProcess - PowerShellEditorServices #845 - Enable UseCorrectCasing as a default rule (Thanks @bergmeister!)
- PowerShellEditorServices #835 -
Map new
powershell.codeformattingsettings WhitespaceInsideBrace and WhitespaceAroundPipe to PSSA settings hashtable (Thanks @bergmeister!) - PowerShellEditorServices #836 - Add PipelineIndentationStyle configuration mapping (Thanks @bergmeister!)
- PowerShellEditorServices #887 - Cherry pick PR 1750 merge commit to legacy/v1.x, has additional fixes (Thanks @rkeithhill!)
- PowerShellEditorServices #874 -
Use public
InternalHostfrom origin runspace (Thanks @SeeminglyScience!) - PowerShellEditorServices #889 - Enhance Get-PsesRpcNotificationMessage/MessageResponseTimes to allow filtering by message name (Thanks @rkeithhill!)
- PowerShellEditorServices #859 - Upgrade PowerShellStandard.Library, PowerShell.SDK, NET.Test.SDK and Serilog NuGet packages to latest released version and enable AppVeyor build on any branch (Thanks @bergmeister!)
- PowerShellEditorServices #862 - Handle arbitrary exceptions when recursing workspace
We are excited to announce the PowerShell Preview extension in the VSCode marketplace! The PowerShell Preview extension allows users on Windows PowerShell 5.1 and PowerShell Core 6 to get and test the latest updates to the PowerShell extension and comes with some exciting features.
The PowerShell Preview extension is a substitute for the PowerShell extension so both the PowerShell extension and the PowerShell Preview extension should not be enabled at the same time.
By having a preview channel, in addition to our existing stable channel, we can get new features out faster and get feedback faster from you, the users.
If you dont already have VSCode, start here.
Once you have VSCode open, click Clt+Shift+X to open the extensions marketplace.
Next, type PowerShell Preview in the search bar.
Click Install on the PowerShell Preview page.
Finally, click Reload in order to refresh VSCode.
If you already have the PowerShell extension, please disable it to use the Powershell Preview extension.
To disable the PowerShell extension, find it in the Extensions sidebar view, specifically under the list of Enabled extensions,
Right-click on the PowerShell extension and select Disable.
Please note that it is important to only have either the PowerShell extension or the PowerShell Preview extension enabled at one time.

The v2.0.0-preview.1 version of the extension is built on .NET Standard (enabling support for both Windows PowerShell and PowerShell Core from one assembly)
It also contains PSReadLine support in the integrated console for Windows behind a feature flag. PSReadLine provides a consistent and rich interactive experience, including syntax coloring and multi-line editing and history, in the PowerShell console, in Cloud Shell, and now in VSCode terminal. For more information on the benefits of PSReadLine, check out their documentation.
To enable PSReadLine support in the Preview version on Windows, please add the following to your user settings:
"powershell.developer.featureFlags": [ "PSReadLine" ]
HUGE thanks to @SeeminglyScience for all his amazing work getting PSReadLine working in PowerShell Editor Services!
As stated above, this version of the PowerShell extension only works with Windows PowerShell versions 5.1 and PowerShell Core 6.
- vscode-PowerShell #1587 - Removed ShowOnlineHelp Command (Thanks @corbob!)
- PowerShellEditorServices #792 - Add Async suffix to async methods (Thanks @dee-see!)
- PowerShellEditorServices #775 - Removed ShowOnlineHelp Message (Thanks @corbob!)
- PowerShellEditorServices #769 - Set Runspaces to use STA when running in Windows PowerShell
- PowerShellEditorServices #741 - Migrate to netstandard2.0 and PSStandard
- PowerShellEditorServices #672 - PSReadLine integration (Thanks @SeeminglyScience!)
- vscode-PowerShell #1632 - Started a document for ISE-like configuration of VSCode. Please help us build it out by contirbuting an edit.
- PowerShellEditorServices #811 - Fix token-based folding (thanks @glennsarti!)
- PowerShellEditorServices #823 - Fix case-sensitivity of Pester CodeLens (thanks @bergmeister!)
- PowerShellEditorServices #815 - Fix crash when untitled files opened as PowerShell
- PowerShellEditorServices #826 - Fix crash when duplicate references are present in the same file
- PowerShellEditorServices #808 - Fix startup crash on Windows 7
- PowerShellEditorServices #807 - Fix deadlock occurring while connecting to named pipes
- vscode-PowerShell #1610 - Remove client-side syntax folding provider in favor of server-side provider (thanks @glennsarti!)
- vscode-PowerShell #1616 -
Make
Restart Current Sessionalways available in the session quick pick - vscode-PowerShell #1406 - Add a Show-Command explorer (thanks @corbob!)
- vscode-PowerShell #1615 - Fix Pester CodeLens not working for running/debugging tests (thanks @rkeithhill!)
- vscode-PowerShell #1600 - Add CodeAction support to show PSSA rule documentation (thanks @rkeithhill!)
- vscode-PowerShell #1606 - Add Ctrl+Alt+J (Cmd+Alt+J on macOS) keybinding to open up list of available snippets
- vscode-PowerShell #1597 -
Make
Install-VSCode.ps1work on macOS and Linux. Get the script here - vscode-PowerShell #1580 -
New-EditorFileworks on non-PowerShell untitled files - vscode-PowerShell #1557 -
Default to showing the last line in folded regions. Unset with
"powershell.codeFolding.showLastLine": false(thanks @glennsarti!) - vscode-PowerShell #1567 - New snippet: Exchange Online connection (thanks @vmsilvamolina!)
- vscode-PowerShell #1567 - New snippet: HTML header (thanks @vmsilvamolina!)
- vscode-PowerShell #1555 - Log when language client not loaded during initialization (thanks @corbob!)
- vscode-PowerShell #1554 - Fix spacing in parameters when starting the extension (thanks @rkeithhill!)
- PowerShellEditorServices #786 - Fix #17: Add go to definition support for dot sourced file paths (Thanks @dee-see!)
- PowerShellEditorServices #767 - Change unhandled messages to warnings instead of errors
- PowerShellEditorServices #765 - Fix PowerShell wildcard escaping in debug paths
- PowerShellEditorServices #778 - Fix multiple occurrences of the same typo (Thanks @dee-see!)
- PowerShellEditorServices #782 - Fix #779: NRE on Dispose in ExecutionTimer (Thanks @dee-see!)
- PowerShellEditorServices #772 - Log build info
- PowerShellEditorServices #774 - New-EditorFile works on non-powershell untitled files
- PowerShellEditorServices #787 - Fix descion/decision typo in visitors (Thanks @dee-see!)
- PowerShellEditorServices #784 - Replace bad StringReader usage with String.Split()
- PowerShellEditorServices #768 - Make pipeline runtime exceptions warnings in log
- PowerShellEditorServices #790 - Add managed thread id to log output to add debugging threading issues (Thanks @rkeithhill!)
- PowerShellEditorServices #794 - Fix Pester CodeLens run/debug by not quoting params/already quoted args (Thanks @rkeithhill!)
- PowerShellEditorServices #785 - Adds ability to use separate pipes for reading and writing (Thanks @ant-druha!)
- PowerShellEditorServices #796 - Code cleanup of the start script and ESHost.cs file (Thanks @rkeithhill!)
- PowerShellEditorServices #795 - Fix file recursion overflow problems
- PowerShellEditorServices #697 - Add functionality to allow a Show-Command like panel in VS Code (Thanks @corbob!)
- PowerShellEditorServices #777 - Add syntax folding (Thanks @glennsarti!)
- PowerShellEditorServices #801 - Fix local remoting
- PowerShellEditorServices #797 - Start of a PSES log file analyzer (Thanks @rkeithhill!)
- PowerShellEditorServices #789 - Add support for a "Show Documentation" quick fix menu entry (Thanks @rkeithhill!)
- PowerShellEditorServices #760 - Fix exception when remoting from Windows to non-Windows (Thanks @SeeminglyScience!)
- vscode-PowerShell #1548 -
Explicitly return
undefinedfrom resolveDbgConfig when session not started (Thanks @rkeithhill!) - vscode-PowerShell #1516 - Change "Get Online Help" menu item label to "Get Help" (Thanks @corbob!)
- vscode-PowerShell #1525 - Remove duplicate/overlapping folding regions (Thanks @glennsarti!)
- PowerShellEditorServices #750 - Fix issue where # in path causes the path to resolve incorrectly
- PowerShellEditorServices #721 - Change Get-Help behavior to return local help when online help can't be displayed (Thanks @corbob!)
- PowerShellEditorServices #748 - Fix index out-of-range exception when deleting script files
- PowerShellEditorServices #749 - Fix crash for finding symbols on bad paths
- PowerShellEditorServices #740 - Fix inner help completion
- PowerShellEditorServices #736 - Cache the reflection call done for completions
- PowerShellEditorServices #737 - Remove LINQ usage in language service methods
- PowerShellEditorServices #743 - Remove unnecessary LINQ calls from LanguageServer
- vscode-PowerShell #1489 - Use asynchronous logic for help completions
- vscode-PowerShell #1477 - Add BitsTransfer & user switch to install latest user profile insiders edition with Install-VSCode.ps1 script (Thanks @tabs-not-spaces!)
- vscode-PowerShell #1485 - Increase connection timeout
- PowerShellEditorServices #728 - Fix formatter crash when script contains parse errors
- PowerShellEditorServices #730 - Fix crash where lines appended to end of script file causes out of bounds exception
- PowerShellEditorServices #732 - Fix CodeLens crash when a file cannot be opened, stop unnecessary file reads in CodeLens
- PowerShellEditorServices #729 - Fix a null dereference when an invalid cast exception has no inner exception
- PowerShellEditorServices #719 - Reduce allocations in the CodeLens providers
- PowerShellEditorServices #725 - Fix null dereference when debugging untitlted filesj
- PowerShellEditorServices #726 - Fix comment-based help snippet
- PowerShell/vscode-powershell #1480 - Use PowerShell signing script in VSTS builds
- PowerShell/vscode-powershell #1460 - Use newer version for preleases
- PowerShell/vscode-powershell #1475 - Change resourceLangId to editorLangId so right-click works properly with unsaved files (Thanks @corbob!)
- PowerShell/vscode-powershell #1467 - Remove region folding from non-region areas (Thanks @glennsarti!)
- PowerShell/PowerShellEditorServices #722 - Add VSTS signing step
- PowerShell/PowerShellEditorServices #717 - Increment version for prerelease
- PowerShell/PowerShellEditorServices #715 - Reduce allocations when parsing files (Thanks @mattpwhite!)
- PowerShell/vscode-powershell #1438 - Fix detecting contiguous comment blocks and regions (Thanks @glennsarti!)
- PowerShell/vscode-powershell #1436 - First approach to fix issue with dbg/run start before PSES running (Thanks @rkeithhill!)
- PowerShell/PowerShellEditorServices #712 - workaround to support inmemory://
- PowerShell/PowerShellEditorServices #706 - Go To Definition works with different Ast types
- PowerShell/PowerShellEditorServices #707 - fix stdio passing
- PowerShell/PowerShellEditorServices #709 - Stop Diagnostic logging from logging to stdio when the communication protocol is set to stdio
- PowerShell/PowerShellEditorServices #710 - stdio should only launch language service not debug
- PowerShell/PowerShellEditorServices #705 - Fix load order of PSSA modules
- PowerShell/PowerShellEditorServices #704 - Do not enable PSAvoidTrailingWhitespace rule by default as it currenly flags whitespace-only lines as well (Thanks @bergmeister!)
- PowerShell/vscode-powershell #1418 - Fix code folding in documents using CRLF newlines. (Thanks @glennsarti!)
- PowerShell/vscode-powershell #1238 - Added functionality to install the VSCode context menus. (Thanks @detlefs!)
- PowerShell/vscode-powershell #1354 - Edit snippet to fix issue #1353 (Thanks @kilasuit!)
- PowerShell/vscode-powershell #1362 - Updated Pester Problem Matcher (Thanks @awickham10!)
- PowerShell/vscode-powershell #1359 - (maint) Add visual ruler for line length (Thanks @glennsarti!)
- PowerShell/vscode-powershell #1344 - Update to TypeScript 2.9.x (Thanks @rkeithhill!)
- PowerShell/vscode-powershell #1323 - SpecProcId - interactive var replacement supports only string type (Thanks @rkeithhill!)
- PowerShell/vscode-powershell #1327 - Switch to named pipes
- PowerShell/vscode-powershell #1321 - GitHub issue template tweaks and add PSSA template (Thanks @bergmeister!)
- PowerShell/vscode-powershell #1320 - Take advantage of multiple issue templates (Thanks @rkeithhill!)
- PowerShell/vscode-powershell #1317 - Change SpecifyScriptArgs command to only return string - not string[] (Thanks @rkeithhill!)
- PowerShell/vscode-powershell #1318 - Update package veresion in lock file, format package.json file. (Thanks @rkeithhill!)
- PowerShell/vscode-powershell #1312 - Updates to Examples PSSA settings file to include more rule config (Thanks @rkeithhill!)
- PowerShell/vscode-powershell #1305 - Make SaveAs work for untitled files
- PowerShell/vscode-powershell #1307 - Added Columns, Improved readability for ToC. (Thanks @st0le!)
- PowerShell/vscode-powershell #1368 - Add new snippet for #region (#1368) (Thanks @lipkau!)
- PowerShell/vscode-powershell #1416 - (GH-1413) Resolve promise correctly in Folding feature (Thanks @glennsarti!)
- PowerShell/vscode-powershell #1412 - Set the extension's log level based on settings value (Thanks @rkeithhill!)
- PowerShell/vscode-powershell #1411 - Escape paths w/single quotes before passing to powershell in single-quoted strings (#1411) (Thanks @rkeithhill!)
- PowerShell/vscode-powershell #1409 - Rename file to match type name (Thanks @rkeithhill!)
- PowerShell/vscode-powershell #1408 - Restore ability to start debug session when script run in PSIC hits breakpoint (Thanks @rkeithhill!)
- PowerShell/vscode-powershell #1407 - Scroll the terminal to bottom for F8 executionPartial fix #1257 (Thanks @rkeithhill!)
- PowerShell/vscode-powershell #1414 - Update grammar parsing for vscode-textmate v4 module (Thanks @glennsarti!)
- PowerShell/vscode-powershell #1397 - Allow debugging in interactive session with no dir change (Thanks @rkeithhill!)
- PowerShell/vscode-powershell #1402 - Move lint directive after the file-header to fix lint error (Thanks @rkeithhill!)
- PowerShell/vscode-powershell #1366 - Add support for side-by-side PS Core preview on Linux/macOS (Thanks @rkeithhill!)
- PowerShell/vscode-powershell #1391 - Add PowerShell Online Help lookup to context menu (Thanks @corbob!)
- PowerShell/vscode-powershell #1396 - Add tslint rule file-header to enforce copyright in TS files (Thanks @rkeithhill!)
- PowerShell/vscode-powershell #1355 - Add syntax aware folding provider (Thanks @glennsarti!)
- PowerShell/vscode-powershell #1395 - Update community_snippets.md (Thanks @fullenw1!)
- PowerShell/vscode-powershell #1382 - Fix markdown syntax (Thanks @lipkau!)
- PowerShell/vscode-powershell #1369 - Update README.md with kbds and what to do if you find a vulnerability
- PowerShell/vscode-powershell #1297 - Added some snippets (#1297) (Thanks @SQLDBAWithABeard!)
-
PowerShell/vscode-powershell #1285 - Add a community snippet for date-annotated
Write-Verbosemessages. -
PowerShell/vscode-powershell #1228 - Make comment-based help trigger always be
##with a new settingpowershell.helpCompletionto allow you to select between help comment styles:BlockComment(default) orLineComment. You can also specify Disabled to disable this functionality. -
PowerShell/vscode-powershell #603 - Fix PowerShell crashing on machines with IPv6 disabled.
-
PowerShell/vscode-powershell #1243 - Support custom PowerShell executable paths in user configuration which can be selected (via name) in either user or workspace configuration.
-
PowerShell/vscode-powershell #1264 - Add support for Visual Studio Live Share.
-
PowerShell/vscode-powershell #1261 - Add support for
$psEditor.GetEditorContext.CurrentFile.SaveAs("NewFileName.ps1"). -
PowerShell/vscode-powershell #1252 - Change the way the extension builds and runs, so that PowerShellEditorServices is self-contained.
-
PowerShell/vscode-powershell #1248 - Replace
$global:IsOSXwith$global:IsMacOS. -
PowerShell/vscode-powershell #1246 - Create community_snippets.md for user created snippets.
-
PowerShell/vscode-powershell #1155 - Fix PSES crashes caused by running "Set PSScriptAnalyzer Rules" on an untitled file.
-
PowerShell/vscode-powershell #1236 - Stop an error occurring when VSCode trims trailing whitespace and sends document update messages.
-
PowerShell/vscode-powershell #996 - Fix
Install-PSCode.ps1crashing due to$IsLinuxvariable in older PowerShell versions. -
PowerShell/vscode-powershell #1234 - Add snippets for Hashtable and PSCustomObject.
-
PowerShell/vscode-powershell #1233 - Add a keybinding for Show Addtional Commands to Shift-Alt-S.
-
PowerShell/vscode-powershell #1227 - Add an indicator for when PowerShell is running in the status bar.
-
PowerShell/vscode-powershell #1225 - Fix launch config not using temporary integrated console setting.
-
PowerShell/vscode-powershell #1208 - Stop configured temporary windows closing after running Pester tests.
-
PowerShell/vscode-powershell #907 - Persist temp console debug session.
-
PowerShell/vscode-powershell #1198 - Enhance Start-EditorServices.ps1 for better logging and fix bugs.
-
PowerShell/PowerShellEditorServices #413 - Allow opening files as not previews to allow Open-EditorFile to open multiple files passed in.
-
PowerShell/vscode-powershell #1177 - Add function-advanced snippet. Thanks to Benny1007!
-
PowerShell/vscode-powershell #1179 - Switch onDebug to onDebugResolve:type for better debugging perf.
-
PowerShell/vscode-powershell #1086 - Add tslint to vscode-powershell and address all issues.
-
PowerShell/vscode-powershell #1153 - Add docs for ps remoting in vscode.
-
PowerShell/vscode-powershell #1161 - Check for the expected version of the PowerShell Editor Services module fails because of the wrong function parameters. Thanks to ant-druha!
-
PowerShell/vscode-powershell #1141 - Updated install script minified URL. Thanks to tabs-not-spaces!
-
PowerShell/PowerShellEditorServices #258 - add .Save() to FileContext API.
-
PowerShell/vscode-powershell #1137 - Added 64bit support & vscode-insiders install support. Thanks to tabs-not-spaces!
-
PowerShell/vscode-powershell #1115 - Fixed "Open in ISE" keyboard shortcut from overwriting basic editing keyboard shortcut.
-
PowerShell/vscode-powershell #1111 - Update examples tasks.json for 2.0.0 schema.
-
PowerShell/vscode-powershell #1100 - Fixed CodeLens on Pester test invocation fails with "Error: command 'vscode.startDebug' not found".
-
PowerShell/vscode-powershell #1091 - Fixed crash when editing remote file using psedit.
-
PowerShell/vscode-powershell #1084 - Fixed authenticode signature 'HashMismatch' on Start-EditorServices.ps1.
-
PowerShell/vscode-powershell #1078 - Fixed debug adapter process terminating when setting breakpoint in an Untitled file or in a Git diff window.
-
Update download.sh to remove macOS OpenSSL check since PowerShell Core Beta and higher no longer depend on OpenSSL. Thanks to elovelan!
-
Get-Help -ShowWindow will no longer error in the PowerShell Integrated Console. The help window will appear but at the moment, it will appear behind VSCode.
-
Fix language server crash when processing a deep directory structure that exceeds max path.
-
PowerShell/vscode-powershell #820 - Added new "Upload Bug Report to GitHub" command to make it easy to post an issue to the vscode-powershell GitHub repo. Thanks to Mark Schill!
-
PowerShell/vscode-powershell #910 - Set-VSCodeHtmlContentView cmdlet now exposes
JavaScriptPathsandStyleSheetPathsparameters to allow using JavaScript code and CSS stylesheets in VS Code HTML preview views. -
PowerShell/vscode-powershell #909 - Write-VSCodeHtmlContentView's AppendBodyContent now accepts input from the pipeline
-
PowerShell/vscode-powershell #1071 - Updated session menu to find PowerShell Core installs with the new pwsh.exe path
-
PowerShell/vscode-powershell #842 - psedit can now open empty files in remote sessions
-
PowerShell/vscode-powershell #1040 - Non-PowerShell files opened in remote sessions using psedit can now be saved back to the remote server
-
PowerShell/vscode-powershell #660 - Set/Enable/Disable/Remove-PSBreakpoint commands now cause the VS Code breakpoint UI to be updated while the debugger is active
-
PowerShell/vscode-powershell #625 - Breakpoints are now cleared from the session when the debugger starts so that stale breakpoints from previous sessions are not hit
-
PowerShell/vscode-powershell #1004 - Handle exception case when finding references of a symbol
-
PowerShell/vscode-powershell #942 - Temporary debugging session now does not hang when running "PowerShell Interactive Session" debugging configuration
-
PowerShell/vscode-powershell #917 - Added PowerShell.InvokeRegisteredEditorCommand command to be used from HTML preview views for invoking editor commands registered in PowerShell. Thanks to Kamil Kosek!
-
PowerShell/vscode-powershell #872 - Watch variables with children are now expandable
-
PowerShell/vscode-powershell #1060 - $psEditor.Workspace.NewFile() now works again in VSC 1.18.0 Insiders builds
-
PowerShell/vscode-powershell #1046 - Debugging now works again in VSC 1.18.0 Insiders builds
-
PowerShell/PowerShellEditorServices #342 - Unexpected file URI schemes are now handled more reliably
-
PowerShell/PowerShellEditorServices #396 - Resolved errors being written to Integrated Console when running native applications while transcription is turned on
-
PowerShell/PowerShellEditorServices #529 - Fixed an issue with loading the PowerShellEditorServices module in PowerShell Core 6.0.0-beta3
-
PowerShell/PowerShellEditorServices #533 - Added new $psEditor.GetCommand() method for getting all registered editor commands. Thanks to Kamil Kosek!
-
PowerShell/PowerShellEditorServices #535 - Type information is now exposed on hover for variables in the Variables view
- #1016 - Fixed a conflict with the "Azure Resource Manager for Visual Studio Code" extension which prevented the PowerShell extension from loading successfully.
- #993 -
powershell.powerShellExePathusing Sysnative path should be automatically corrected when using 64-bit Visual Studio Code - #1008 - Windows PowerShell versions (x64 and x86) are not enumerated correctly when using 64-bit Visual Studio Code
- #1009 - PowerShell version indicator in status bar is missing tooltip
- #1020 - "Show Session Menu", "Show Integrated Console", and "Restart Current Session" commands should cause PowerShell extension to be activated
- PowerShell/PowerShellEditorServices#529 - Fixed an issue with loading the extension with in PowerShell Core 6.0.0-beta3
You can now show editor tabs with custom HTML-based UI by using the new HTML content view commands! This is the first step toward UI extensions for VS Code written in PowerShell.
Here's an example:
$view = New-VSCodeHtmlContentView -Title "My Custom View" -ShowInColumn One
Set-VSCodeHtmlContentView -View $view -Content "<h1>Hello world!</h1>"
Write-VSCodeHtmlContentView $view -Content "<b>I'm adding new content!</b><br />"
And here's the result:
Check out the cmdlet help for the following commands to learn more:
New-VSCodeHtmlContentViewShow-VSCodeHtmlContentViewClose-VSCodeHtmlContentViewSet-VSCodeHtmlContentViewWrite-VSCodeHtmlContentView
Since this is a first release, we've restricted the use of JavaScript inside of the HTML. We will add this capability in a future release!
We've now added code formatting presets for the most common code style conventions used in the PowerShell community:
-
OTBS - Known as the "One True Brace Style". Causes
else,catch, and other keywords to be "cuddled", keeping them on the same line as the previous closing brace:if ($var -eq $true) { # Do the thing } else { # Do something else }
-
Stroustrup - Causes beginning curly braces to be placed on the same line as the statement:
if ($var -eq $true) {
  # Do the thing
} else {
  # Do something else
}
-
Allman - All curly braces are preceded by a newline:
if ($var -eq $true) {
  # Do the thing
}
else {
  # Do something else
}
-
Custom - Allows full customization of the code formatting settings.
In addition, code formatting now respects your editor.insertSpaces and
editor.tabSize settings!
We've added the ability to debug your PowerShell code in a temporary PowerShell Integrated Console so that you have a fresh runspace and PowerShell process each time you hit F5!
This setting is necessary if you are developing with PowerShell 5 classes or modules using .NET assemblies because .NET types cannot be reloaded inside of the same PowerShell process. This new setting saves you from reloading your PowerShell session each time you debug your code!
You can configure this behavior in two ways:
-
Use the
launch.jsonconfiguration parametercreateTemporaryIntegratedConsole:{ "type": "PowerShell", "request": "launch", "name": "PowerShell Launch Current File in Temporary Console", "script": "${file}", "args": [], "cwd": "${file}", "createTemporaryIntegratedConsole": true }, -
Configure the setting
powershell.debugging.createTemporaryIntegratedConsole:"powershell.debugging.createTemporaryIntegratedConsole": true,
The default value for these settings is false, meaning that the temporary
console behavior is opt-in.
Configuring the user or workspace setting will cause all debugging sessions
to be run in a temporary Integrated Console so it's useful if you would prefer
this to be the default behavior. The launch.json setting overrides the user
setting so you can always customize the behavior for a specific launch
configuration.
You can now create a new untitled file from within the Integrated Console
by using the $psEditor.Workspace.NewFile() command! Also, you can send
the formatted output of any PowerShell command to the current file by using
the Out-CurrentFile command:
Get-Process | Out-CurrentFileSpecial thanks to Doug Finke for the contribution!
-
#881 - When you select a different PowerShell version in the session menu, your choice is persisted to the
powershell.powerShellExePathsetting. -
#891 - Pester CodeLenses now run tests without string interpolation of test names
-
PowerShell/vscode-powershell#864 - Improved the visibility of hyphen characters on the currently edited line in the PowerShell ISE theme (thanks Stefan Stranger!)
-
PowerShell/vscode-powershell#857 - Typing a new function into a file no longer causes the language server to crash
-
PowerShell/vscode-powershell#855 - "Format Document" no longer hangs indefinitely
-
PowerShell/vscode-powershell#859 - Language server no longer hangs when opening a Pester test file containing dot-sourced script references
-
PowerShell/vscode-powershell#856 - CodeLenses for function definitions no longer count the definition itself as a reference and shows "0 references" when there are no uses of that function
-
PowerShell/vscode-powershell#838 - Right-clicking a debugger variable and selecting "Add to Watch" now has the desired result
-
PowerShell/vscode-powershell#837 - Debugger call stack now navigates correctly to the user's selected stack frame
-
PowerShell/vscode-powershell#862 - Terminating errors in the language server now close the Integrated Console immediately and prompt the user to restart the session
-
PowerShell/PowerShellEditorServices#505 - Added improved cmdlet help in the PowerShellEditorServices.Commands module
-
PowerShell/PowerShellEditorServices#509 - Importing the PowerShellEditorServices.Commands module no longer causes errors to be written about missing help languages
-
#850 - Fixed an issue where lower-cased "describe" blocks were not identified by the CodeLens feature.
-
#851 - Fixed an issue where the language server would hang when typing out a describe block.
-
#852 - Fixed an issue where Pester test names would not be detected correctly when other arguments like -Tags were being used on a Describe block.
We've added two new CodeLens actions that show up above Describe blocks in your Pester tests, "Run tests" and "Debug tests". By clicking one of these CodeLenses, your tests will be executed in the Integrated Console with the debugger attached. You can now set breakpoints and quickly debug a portion of your test script:
We've also added CodeLenses for showing the number of references for a function or cmdlet that is defined in a script. If you click this CodeLens, the references pane will appear so that you can navigate through all of the references:
We will add CodeLens support for PowerShell 5+ classes and class methods in a future update!
We've also added document symbol support for Pester tests so that you can easily navigate among the Describe, Context, and It blocks in large Pester script files:
We now include a new color theme that tries to provide a faithful interpretation of the PowerShell ISE's style, including a blue console background! To use this theme open the Command Palette (Ctrl+Shift+P), run the "Preferences: Color Theme" command, then select "PowerShell ISE".
This is a first attempt at making this happen so give us feedback if you think that the colors can be improved! Super huge thanks to Matt McNabb for putting this together!
Thanks to new PowerShell Editor Services co-maintainer Patrick Meinecke, we've gained a new set of useful commands for interacting with the $psEditor APIs within the Integrated Console:
- Find-Ast
- Get-Token
- ConvertFrom-ScriptExtent
- ConvertTo-ScriptExtent
- Set-ScriptExtent
- Join-ScriptExtent
- Test-ScriptExtent
- Import-EditorCommand
This should also resolve the issues some people were seeing when we tried
to load the unsigned temporary script containing Register-EditorCommand
on machines with an AllSigned execution policy (#784).
- #827 - Fixed an issue where an Output panel will appear with an error when you close the PowerShell Integrated Terminal
-
PowerShell/PowerShellEditorServices#478 - Dynamic comment help snippets now generate parameter fields correctly when
<#is typed above aparam()block. -
#808 - An extra
PS>is no longer being written to the Integrated Console for some users who have custom prompt functions. -
#813 - Finding references of symbols across the workspace now properly handles inaccessible folders and file paths
-
#810 -
$psEditor.GetEditorContext()now doesn't throw exceptions when in an untitled file -
#807 - The users's previously selected PowerShell session type is now retained when running the "PowerShell: Restart Current Session" command.
-
#821 - Note properties on PSObjects are now visible in the debugger's Variables view
Dynamic comment-based help snippets now work inside functions (#763)
You asked for it, you got it! Dynamic comment-based help snippets now work
inside function definitions, both above the param() block and at the end
of the function body:

NOTE: There is an issue where parameter sections don't get generated inside of a function
with a [CmdletBinding()] attribute. This is being tracked at PowerShell/PSScriptAnalyzer#768.
Session menu now contains entries for PowerShell Core installations on Windows (#794)
It's now much easier to switch between Windows PowerShell and PowerShell Core installs on Windows. When you run the "PowerShell: Show Session Menu" command or click the PowerShell version indication in the status bar you'll now see PowerShell Core entries in the menu:

The green squiggle markers you receive from PSScriptAnalyzer now include the name of the corresponding rule in their description:

This is really helpful with the new rule suppression snippets contributed by
Jos Verlinde! You can access them by typing
suppress- and selecting one of the suppression snippet options:

New built-in Pester problem matcher (#798)
We now include a built-in problem matcher
for Pester test output so that you don't need to define one in your tasks.json
file any longer! You can reference the built-in problem matcher in your test
tasks by using the name $pester:
    {
        "taskName": "Test",
        "suppressTaskName": true,
        "isTestCommand": true,
        "showOutput": "always",
        "args": [ "Invoke-Pester -PesterOption @{IncludeVSCodeMarker=$true}" ],
        "problemMatcher": "$pester"
    }
NOTE: There is an issue with problem matchers when using the new 2.0.0
version of VS Code's task runner. Pester errors may show up multiple
times in the Problems panel. This issue is being tracked at
#797.
-
#710 - Variable definitions can now be found across the workspace
-
#771 - Improved dynamic comment help snippet performance in scripts with many functions
-
#786 - Running the "Show Integrated Console" command will now start the extension if it isn't already started
-
#774 - Pressing Enter now causes custom prompt functions to be fully evaluated
-
#770 - Fixed issue where custom prompt function might be written twice when starting the integrated console
-
#767 - Fixed placeholder navigation for many built-in snippets
-
#782 - Fixed extension host crash when restarting the PowerShell session
-
#737 - Fixed hangs and high CPU when restarting or switching between PowerShell sessions
-
#777 - Changed "Starting PowerShell" message to clearly indicate that we're in the PowerShell Integrated Console
New dynamic snippet for adding comment-based help (#748)
We've added a really cool new feature that enables you to create comment-based help blocks with ease! When you've defined a function in a PowerShell script file, you can now start typing a comment block above the function definition and it will be completed for you:

This comment block works like a snippet, allowing you to tab through the fields to quickly add documentation for the parts you care about.
This is a first pass for this feature and we plan to do more with it in the future. Please feel free to file feature requests for anything else you'd like to see!
Breakpoints hit in the Integrated Console now activate the debugger UI (#619)
In previous releases it was necessary to start the "PowerShell Interactive Session" debugging configuration before you could run a command or script from the Integrated Console and hit breakpoints in the editor UI. We've just removed this limitation!
Now when you set a breakpoint using Set-PSBreakpoint and run a script or command in the
Integrated Console, the debugger UI now gets activated:

Note that breakpoints set in the Integrated Console still do not show up in the editor UI; this requires changes to VS Code that we'll be contributing for their next feature release.
We now write the errors and Write-Output calls that occur while loading profile scripts so that it's easier to diagnose issues with your profile scripts. This fix will help us identify the things missing from the Integrated Console which cause your profile scripts to fail (like the current lack of a PrivateData object for setting console colors).
Please feel free to file issues for anything that causes your profile scripts to throw errors when they get loaded!
-
#751 - Removed keybinding for the "Find PowerShell Modules from the Gallery" command because it conflicts with VS Code's default "Format Selection" keybinding.
-
#739 - Fixed wording of PowerShell extension commands to have consistent capitalization. Thanks to @AndySchneiderDev for the contribution!
We are excited to announce that we've reached version 1.0! For more information, please see the official announcement on the PowerShell Team Blog.
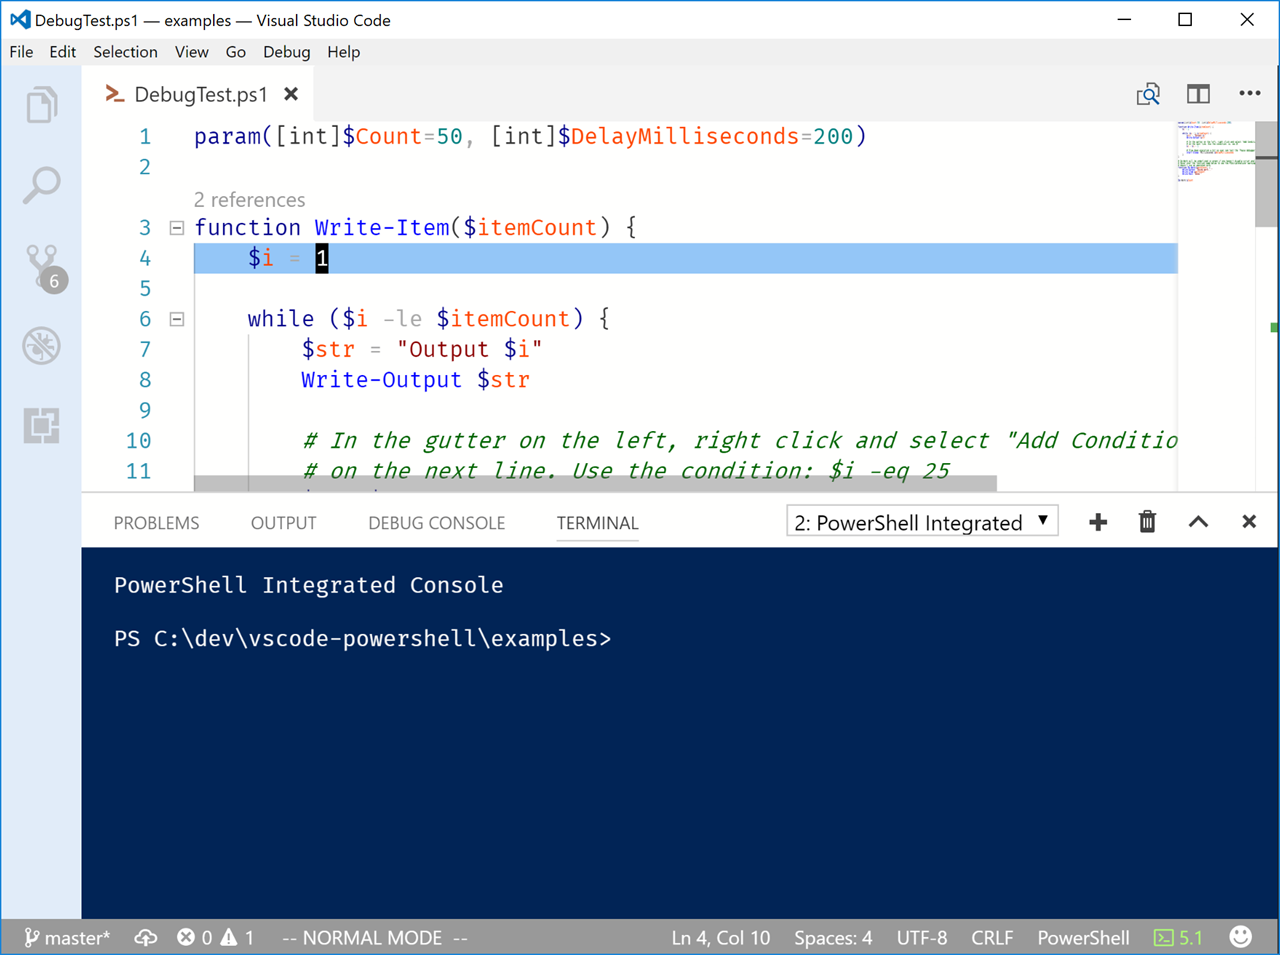
New script argument UI when debugging (#705)
You can now set PowerShell debugger configurations to prompt for arguments to be
passed to your script when it is executed. This is configured using the new
${command:SpecifyScriptArgs} configuration variable in launch.json:
        {
            "type": "PowerShell",
            "request": "launch",
            "name": "PowerShell Launch DebugTest.ps1 w/Args Prompt",
            "script": "${workspaceRoot}/DebugTest.ps1",
            "args": [ "${command:SpecifyScriptArgs}" ],
            "cwd": "${file}"
        }
When you launch this configuration you will see a UI popup asking for arguments:

You can type your arguments to the script as you would in PowerShell:
-Count 5
In future executions of this configuration, you will be presented with the arguments you typed the last time you ran it so that you can easily edit them and test variations!
New hash table alignment formatting rule (#672)
We've added a new code formatting rule that automatically aligns the equal sign in assignments of keys in hash tables or DSC configurations. It also works with nested hash tables! Here's a simple example:
Before
$formatTest = @{
    Apple = 4
    Tangerine = @{
        Orange = 2
        CornflowerBlue = 6
    }
    Banana = 3
}
After
$formatTest = @{
    Apple     = 4
    Tangerine = @{
        Orange         = 2
        CornflowerBlue = 6
    }
    Banana    = 3
}
This formatting rule is enabled by default but can be disabled with the following setting:
"powershell.codeFormatting.alignPropertyValuePairs": false
In the past, finding the references or definition of a function in FileA.ps1 only
worked if FileA.ps1 had an explicit dot-source invocation of FileB.ps1. We have
removed this limitation so that you can now find definitions and references of any
function across all the script files in your project folder! This is especially
useful if you write PowerShell modules where all of the source files are dot-sourced
inside of the .psm1 file.
This new implementation is very basic and may give unexpected results, so please file an issue on GitHub if you get a result you did not expect!
-
Fixed #698 - When debugging scripts in the integrated console, the cursor position should now be stable after stepping through your code! Please let us know if you see any other cases where this issue appears.
-
Fixed #626 - Fixed an issue where debugging a script in one VS Code window would cause that script's output to be written to a different VS Code window in the same process.
-
Fixed #618 - Pressing enter on an empty command line in the Integrated Console no longer adds the empty line to the command history.
-
Fixed #617 - Stopping the debugger during a prompt for a mandatory script parameter no longer crashes the language server.
-
Fixed PowerShellEditorServices #428 - Debugger no longer hangs when you stop debugging while an input or choice prompt is active in the integrated console.
-
Fixed #662 - Changed usage of
$env:PSMODULEPATHto$env:PSModulePathto conform to a recent change in PowerShell 6 (PowerShell/PowerShell#3255) which makes the casing ofPSModulePathconsistent between Windows and the *NIX platforms.NOTE: This is a breaking change for PowerShell extension users on Linux and macOS
If you are using PowerShell 6.0.0-alpha.17 or lower you will need to upgrade to 6.0.0-alpha.18.
-
Fixed #645 - "Go to Definition" or "Find References" now work in untitled scripts without crashing the session
-
Fixed #632 - Debugger no longer hangs when launched while PowerShell session is still initializing
-
Fixed #655 - Fixed an issue with current working directory being set incorrectly when debugging untitled script files
-
Fixed PowerShellEditorServices #430 - Resolved occasional IntelliSense slowness by preventing the implicit loading of the PowerShellGet and PackageManagement modules. This change will be reverted once a bug in PackageManagement is fixed.
-
Fixed PowerShellEditorServices #427 - Fixed an occasional crash when requesting editor IntelliSense while running a script in the debugger
-
Fixed PowerShellEditorServices #416 - Cleaned up errors that would appear in the
$Errorsvariable from the use ofGet-CommandandGet-Helpin IntelliSense results
- Fixed #648 - Resolved an error when launching an untitled script file in a workspace with no launch.json or in a window without a workspace path
Debugging untitled files (#555)
You can now debug untitled files that are set to the PowerShell language mode. When you create a new untitled file, use the "Change Language Mode" command (Ctrl+K M) and choose "PowerShell" from the menu that appears. You can now press F5 to start debugging the script file without saving it.
In the upcoming 1.11.0 release of Visual Studio Code (or in the current VS Code Insiders
release), you can configure the new files.defaultLanguage setting to powershell in either
your User or Workspace settings to cause all untitled files to be created with the PowerShell
mode by default. This will allow you to create new PowerShell scripts and debug them
immediately without saving first!
New right-click context menu for Run Selection (#581)
By user request, we've also added a new "Run Selection" item in the right-click context menu for PowerShell script files:

-
Fixed #620 - PowerShell session now does not crash when a breakpoint is hit outside of debug mode
-
Fixed #614 - Auto variables are now populating correctly in the debugger. NOTE: There is a known issue where all of a script's variables begin to show up in the Auto list after running a script for the first time. This is caused by a change in 0.11.0 where we now dot-source all debugged scripts. We will provide an option for this behavior in the future.
-
Fixed #641 - PowerShell script files with capitalized extensions (.PS1, .PSM1) can now be launched in the debugger
-
Fixed #616 - Debugger now shows column position indicators when debugging pipelines or nested expressions:

- Fixed PowerShell/PowerShellEditorServices#411 -
Commands run outside of the integrated console prompt now interrupt the prompt
correctly. This resolves a class of issues that appear when running commands
in the extension like "New Project from Plaster Template" or any
$psEditorcommands added with the "Register-EditorCommand" function. Running any of these commands will now cause the current input prompt to be cancelled so that the command's output will be written correctly.
-
Fixed #595 - High CPU usage when using formatOnType has now been resolve
-
Fixed #559 - The
newLineAfterCloseBracebehavior has been improved to respect common syntax usages -
FixedPowerShell/PowerShellEditorServices#380 - The
whitespaceBeforeOpenBracebehavior now leaves "magic" functions with the correct formatting. For example:(0 .. 10).foreach{$_}now does not have a whitespace inserted before the{.
-
Fixed #643 - Running Plaster using the New Project command now interrupts the command prompt correctly
-
Fixed #504 - Confirming default values in Plaster input prompts by pressing Enter now works correctly
-
Added #639 and #640 - Our configuration setting descriptions have been edited for superior clarity thanks to June Blender!
-
Fixed #611 - Example-* snippets are now displaying correctly in IntelliSense results
-
Added #624 - When you update the PowerShell extension after this release, you will now see version update indicators which offer to display the changelog in a preview tab
- Added #583 -
When you open files in a remote PowerShell session with the
pseditcommand, their updated contents are now saved back to the remote machine when you save them in the editor.
-
Fixed #533 - The backspace key now works in the integrated console on Linux and macOS. This fix also resolves a few usability problems with the integrated console on all supported OSes.
-
Fixed 542 - Get-Credential now hides keystrokes correctly on Linux and macOS.
We also added some new settings (#580, #588) to allow fine-tuning of the integrated console experience:
-
powershell.startAutomatically(default:true) - If true, causes PowerShell extension features to start automatically when a PowerShell file is opened. If false, the user must initiate startup using the 'PowerShell: Restart Current Session' command. IntelliSense, code navigation, integrated console, code formatting, and other features will not be enabled until the extension has been started. Most users will want to leave this setting totrue, though it was added to save CPU cycles if you often use new VS Code instances to quickly view PowerShell files. -
powershell.integratedConsole.showOnStartup(default:true) - If true, causes the integrated console to be shown automatically when the PowerShell extension is initialized. -
powershell.integratedConsole.focusConsoleOnExecute(default:true) - Iftrue, causes the integrated console to be focused when a script selection is run or a script file is debugged.
-
Added #540 - The scripts that you debug are now dot-sourced into the integrated console's session, allowing you to experiment with the results of your last execution.
-
Added #600 - Debugger commands like
stepInto,continue, andquitare now available in the integrated console while debugging a script. -
Fixed #596 - VS Code's Debug Console now warns the user when it is used while debugging a script. All command evaluation now happens through the integrated console so this message should help alleviate confusion.
- Fixed #579 - Sorting of IntelliSense results is now consistent with the PowerShell ISE
- Fixed #591 -
"Editor commands" registered with the
Register-EditorCommandfunction are now sorted alphabetically by theirNamefield, causing commands to be grouped based on their source module. - Fixed #575 -
The interactive console no longer starts up with errors in the
$Errorvariable. - Fixed #599 - The SSASCMDLETS module from SQL Server Analytics Service should now load correctly in the integrated console.
- Fixed #566 - Enable editor IntelliSense while stopped at a breakpoint
- Fixed #556 - Running and debugging scripts in the integrated console should not steal focus from the editor
- Fixed #543 - Keyboard input using AltGr Ctrl+Alt modifiers does not work
- Fixed #421 - Session startup should give a helpful error message if ConstrainedLanguage mode is turned on
- Fixed #401 - Session startup should indicate if current PowerShell version is unsupported (PSv1 and v2)
- Fixed #454 - ExecutionPolicy set via group policy or registry key should not cause language server to crash
- Fixed #532 - DEVPATH environment variable not being set for interactive console session
- Fixed PowerShellEditorServices #387 - Write-(Warning, Verbose, Debug) are missing message prefixes and foreground colors
- Fixed PowerShellEditorServices #382 - PSHostUserInterface implementation should set SupportsVirtualTerminal to true
We are excited to provide you with the first release of our new interactive console experience! When you open up a PowerShell script file, you will be greeted with a new VS Code integrated terminal window called "PowerShell Integrated Console"

In this console you will have an experience that falls somewhere between the PowerShell ISE and the PowerShell console host:
- Tab completion of commands and their parameters
- Basic command history, accessed using the up/down arrow keys
- The
pseditcommand opens existing files in an editor pane - Pressing F8 in an editor pane runs the current line or selection in the console
- Native applications like
gitare fully supported - Script debugging shares the same console session with the editor for a true ISE-like debugging experience
It even works with your fancy prompt function if configured in your
VS Code profile ($HOME\Documents\WindowsPowerShell\Microsoft.VSCode_profile.ps1):

The integrated console is supported on PowerShell v3 through v6 and works
on Linux and macOS with PowerShell Core. By default you don't have to
configure which PowerShell to run, we will pick an appropriate default
based on your platform. If you'd like to choose a different install
of PowerShell you can always change the powershell.developer.powerShellExePath
setting.
Keep in mind that this is the first release for this feature and there are bound to be issues and missing functionality. Please feel free to file GitHub issues for any bugs or feature requests!
- #535 PSReadline is currently not supported in the integrated console. We will enable this in a future release.
- #534 Integrated console prompt is not restarted when you stop the debugging of a local runspace in another process. This will be addressed soon in a patch update.
- #533 Backspace key does not work in the integrated console on Linux and macOS. The workaround for now is to use Ctrl+H instead of the Backspace key. This will be addressed soon in a patch update.
- #536 Integrated console sometimes does not have a scrollbar at startup. The workaround is to resize the width of the VS Code window slightly and the scrollbar will appear. This will be addressed soon in a patch update.
Now that we have the integrated console, we have added support for the Get-Credential
cmdlet, Read-Host -AsSecureString, and any input prompt of type SecureString or PSCredential.
When you run any of these cmdlets you will be prompted inside the integrated console:

We now support VS Code's editor.formatOnType setting so that your code gets formatted
as you type! Formatting will be triggered when you press Enter or the closing curly
brace character }.
Based on your feedback, we've also added new code formatting options, all of which are turned on by default:
powershell.codeFormatting.newLineAfterCloseBrace- Causes a newline to be inserted after a closing brace in multi-line expressions like if/elsepowershell.codeFormatting.whitespaceBeforeOpenBrace- Causes whitespace to be inserted before an open brace likeForeach-Object {powershell.codeFormatting.whitespaceBeforeOpenParen- Causes whitespace to be inserted before an open parentheses likeif (powershell.codeFormatting.whitespaceAroundOperator- Causes whitespace to be inserted around operators like=or+powershell.codeFormatting.whitespaceAfterSeparator- Causes whitespace to be inserted around separator characters like;and,powershell.codeFormatting.ignoreOneLineBlock- Single-line expressions, like small if/else statements, will not be expanded to multiple lines.
We've also made many improvements to the performance and stability of the formatter.
We've added a new configuration for debugging your Pester tests. By default it
merely runs Invoke-Pester at the workspace path, but you can also edit the
configuation to add additional arguments to be passed through.
We've also added support for column breakpoints. Now you can set a breakpoint
directly within a pipeline by placing your cursor at any column on a line and
running the Debug: Column Breakpoint command:

For the latest PowerShell Core release (6.0.0-alpha.17),
we have also added the ability to step into ScriptBlocks that are executed on another
machine using Invoke-Command -Computer.
Set a breakpoint on an Invoke-Command line and then once it's hit:

Press F11 and you will step into the ScriptBlock. You can now continue to use
"step in" and trace the ScriptBlock's execution on the remote machine:

Note that you cannot currently set breakpoints in the script listing file as this code is being executed without an actual script file on the remote machine.
- Fixed #427 - The keybinding for "Expand Alias" command has been changed to Shift+Alt+E
- Fixed #519 - Debugger hangs after continuing when watch expressions are set
- Fixed #448 - Code formatter should keep indentation for multi-line pipelines
- Fixed #518 -
Code formatter fails when dollar-paren
$()expressions are used - Fixed #447 - Code formatter crashes when run on untitled documents
We've added a formatter for PowerShell code which allows you to format an
entire file or a selection within a file. You can access this formatter by
running VS Code's Format Document and Format Selection commands inside
of a PowerShell file.
You can configure code formatting with the following settings:
powershell.codeFormatting.openBraceOnSameLine- Places open brace on the same line as its associated statement. Default istrue.powershell.codeFormatting.newLineAfterOpenBrace- Ensures that a new line occurs after an open brace (unless in a pipeline statement on the same line). Default istrueeditor.tabSize- Specifies the indentation width for code blocks. This is a VS Code setting but it is respected by the code formatter.editor.formatOnSave- If true, automatically formats when they are saved. This is a VS Code setting and may also affect non-PowerShell files.
Please note that this is only a first pass at PowerShell code formatting, it may not format your code perfectly in all cases. If you run into any issues, please file an issue and give us your feedback!
NOTE: This improvement depends on VS Code 1.9.0 which is due for release early February! However, you can try it out right now with the VS Code Insiders release.
Thanks to a new improvement in VS Code's debugging APIs, we are now able to
launch the PowerShell debugger on a script file without the need for a launch.json
file. You can even debug individual PowerShell scripts without opening a
workspace folder! Don't worry, you can still use a launch.json file to configure
specific debugging scenarios.
We've also made debugger startup much more reliable. You will no longer see the dreaded "Debug adapter terminated unexpectedly" message when you try to launch the debugger while the language server is still starting up.
We now support remote PowerShell sessions via the Enter-PSSession
cmdlet. This cmdlet allows you to create a PowerShell session on another machine
so that you can run commands or debug scripts there. The full debugging
experience works with these remote sessions on PowerShell 4 and above, allowing
you to set breakpoints and see remote files be opened locally when those breakpoints
are hit.
For PowerShell 5 and above, we also support attaching to local and remote PowerShell
host processes using the Enter-PSHostProcess
and Debug-Runspace
cmdlets. This allows you to jump into another process and then debug a script that
is already running in one of the runspaces in that process. The debugger will break
execution of the running script and then the associated script file will be opened
in the editor so that you can set breakpoints and step through its execution.
We've also added a new launch.json configuration for debugging PowerShell host processes:

When launched, the default "attach" configuration will prompt you with a list of PowerShell host processes on the local machine so that you can easily select one to be debugged:

You can also edit the launch configuration to hardcode the launch parameters, even setting a remote machine to connect to before attaching to the remote process:
        {
            "type": "PowerShell",
            "request": "attach",
            "name": "PowerShell Attach to Host Process",
            "computerName": "my-remote-machine",
            "processId": "12345",
            "runspaceId": 1
        }
Please note that we currently do not yet support initiating remote sessions from Linux or macOS. This will be supported in an upcoming release.
Another nice improvement is that we now support the psedit command in remote and
attached sessions. This command allows you to open a file in a local or remote session
so that you can set breakpoints in it using the UI before launching it. For now these
remotely-opened files will not be saved back to the remote session when you edit and
save them. We plan to add this capability in the next feature update.
You can now create a new launch configuration which drops you directly into the debug console so that you can debug your scripts and modules however you wish. You can call Set-PSBreakpoint to set any type of breakpoint and then invoke your code through the console to see those breakpoints get hit. This mode can also be useful for debugging remote sessions.

Please note that this is NOT a replacement for a true interactive console experience. We've added this debugging configuration to enable a few other debugging scenarios, like debugging PowerShell modules, while we work on a true interactive console experience using VS Code's Terminal interface.
We've extended our document symbol support to .psd1 files to make it really easy to
navigate through them. When you have a .psd1 file open, run the Go to Symbol in File...
command (Ctrl + Shift + O) and you'll see this popup:

You can type a symbol name or navigate using your arrow keys. Once you select one of the symbol names, the editor pane will jump directly to that line.
- Added a new
Open Examples Foldercommand to easily open the extension's example script folder. - Added a new setting
powershell.developer.powerShellExeIsWindowsDevBuildwhich, when true, indicates that thepowerShellExePathpoints to a Windows PowerShell development build. - Fixed #395: Quick Fix for PSAvoidUsingAliases rule replaces the entire command
- Fixed #396: Extension commands loaded in PowerShell profile are not being registered
- Fixed #391: DSC IntelliSense can cause the language server to crash
- Fixed #400: Language server can crash when selecting PSScriptAnalyzer rules
- Fixed #408: Quick fix requests meant for other extensions crash the language server
- Fixed #401: Extension startup should indicate if the current PowerShell version is unsupported
- Fixed #314: Errors/Warnings still show up in Problems window when file is closed
- Fixed #388: Syntax errors are not reported when powershell.scriptAnalysis.enable is set to false
It's now much easier to manage the active PowerShell session. We've added a new item to the status bar to indicate the state of the session and the version of PowerShell you're using:

When this status item is clicked, a new menu appears to give you some session management options:

You can restart the active session, switch between 32-bit and 64-bit PowerShell on
Windows or switch to another PowerShell process (like a 6.0 alpha build) that
you've configured with the powershell.developer.powerShellExePath.
We've also improved the overall experience of loading and using the extension:
- It will prompt to restart the PowerShell session if it crashes for any reason
- It will also prompt to restart the session if you change any relevant PowerShell
configuration setting like the aforementioned
powershell.developer.powerShellExePath. - You can easily access the logs of the current session by running the command
Open PowerShell Extension Logs Folder.
In this release we've added integration with the Plaster
module to provide a Create New Project from Plaster Template command. This command will
walk you through the experience of selecting a template and filling in all of
the project details:


We include one basic project template by default and will add more in the very near future. However, you won't need to update the PowerShell extension to get these new templates, they will appear when you install an update to the Plaster module from the PowerShell Gallery.
Check out Plaster's documentation for more details on how it can be used and how you can create your own templates.
The PowerShell extension now uses any "suggested corrections" which are returned with
a rule violation in your script file to provide a "quick fix" option for the affected
section of code. For example, when the PSAvoidUsingCmdletAliases rule finds the use
of a non-whitelisted alias, you will see a light bulb icon that gives the option to
change to the full name (right click or Ctrl+. on the marker):

If you'd like to see more quick fixes for PowerShell code, head over to the PSScriptAnalyzer GitHub page and get involved!
Another improvement related to PSScriptAnalyzer is the ability to change the active PSScriptAnalyzer rules in the current editing session using a helpful selection menu:

You can enable and disable active rules by running the Select PSScriptAnalyzer Rules
command. For now this only changes the active session but in a future release we will
modify your PSScriptAnalyzer settings file so that the changes are persisted to future
editing sessions.
When debugging PowerShell scripts you can now set "hit count" breakpoints which cause the debugger to stop only after the breakpoint has been encountered a specified number of times.

- We now provide snippets for the
launch.jsonconfiguration file which make it easier to add new PowerShell debugging configurations for your project. - In PowerShell
launch.jsonconfigurations, theprogramparameter has now been renamed toscript. Configurations still usingprogramwill continue to work. - Fixed #353: Cannot start PowerShell debugger on Windows when offline
- Fixed #217: PowerShell output window should be shown when F8 is pressed
- Fixed #292: Check for Homebrew's OpenSSL libraries correctly on macOS
- Fixed #384: PowerShell snippets broken in VS Code 1.8.0
- Fixed #243: Debug adapter process has terminated unexpectedly
- Fixed #264: Add check for OpenSSL on OS X before starting the language service
- Fixed #271: PSScriptAnalyzer settings path isn't being passed along
- Fixed #273: Debugger crashes after multiple runs
- Fixed #274: Extension crashes on Ctrl+Hover
- "Auto" variable scope in debugger UI now expands by default
- Fixed #244: Extension fails to load if username contains spaces
- Fixed #246: Restore default PSScriptAnalyzer ruleset
- Fixed #248: Extension fails to load on Windows 7 with PowerShell v3
This release marks the beginning of our support for Linux and macOS via the new cross-platform release of PowerShell. You can find installation and usage instructions at the PowerShell GitHub repository.
- Fixed #231: In VS Code 1.4.0, IntelliSense has stopped working
- Fixed #193: Typing "n" breaks intellisense
- Fixed #187: Language server sometimes crashes then $ErrorActionPreference = "Stop"
- Fixed #180: Profile loading should be enabled by default
- Fixed #183: Language server sometimes fails to initialize preventing IntelliSense, etc from working
- Fixed #182: Using 'Run Selection' on a line without a selection only runs to the cursor position
- Fixed #184: When running a script in the debugger, $host.Version reports wrong extension version
- We've added a new extensibility model which allows you to write PowerShell
code to add new functionality to Visual Studio Code and other editors with
a single API. If you've used
$psISEin the PowerShell ISE, you'll feel right at home with$psEditor. Check out the documentation for more details!
- We've now introduced the
$profilevariable which contains the expected properties that you normally see inpowershell.exeandpowershell_ise.exe:AllUsersAllHostsAllUsersCurrentHostCurrentUserAllHostsCurrentUserCurrentHost
- In Visual Studio Code the profile name is
Microsoft.VSCode_profile.ps1. $host.Namenow returns "Visual Studio Code Host" and$host.Versionreturns the version of the PowerShell extension that is being used.
- IntelliSense for static methods and properties now works correctly. If you
type
::after a type such as[System.Guid]you will now get the correct completion results. This also works if you pressCtrl+Spaceafter the::characters. $envvariables now have IntelliSense complete correctly.- Added support for new VSCode command
Debug: Start Without Debugging. Shortcut for this command is Ctrl+F5. - Changed the keyboard shortcut for
PowerShell: Expand Aliasfrom Ctrl+F5 to Ctrl+Alt+e. - Added support for specifying a PSScriptAnalyzer settings file by
providing a full path in your User Settings for the key
powershell.scriptAnalysis.settingsPath. You can also configure the same setting in your project's.vscode\settings.jsonfile to contain a workspace-relative path. If present, this workspace-level setting overrides the one in your User Settings file. See the extension'sexamples\.vscode\settings.jsonfile for an example. - The debug adapter now does not crash when you attempt to add breakpoints for files that have been moved or don't exist.
- Fixed an issue preventing output from being written in the debugger if you don't set a breakpoint before running a script.
powershell.scriptAnalysis.settingsPath: Specifies the path to a PowerShell Script Analyzer settings file. Use either an absolute path (to override the default settings for all projects) or use a path relative to your workspace.
- Support for PowerShell v3 and v4 is now complete! Note that for this release, Script Analyzer support has been disabled for PS v3 and v4 until we implement a better strategy for integrating it as a module dependency
-
Added support for command breakpoints.
Hover over the Debug workspace's 'Breakpoints' list header and click the 'Add' button then type a command name (like
Write-Output) in the new text box that appears in the list. -
Added support for conditional breakpoints.
Right click in the breakpoint margin to the left of the code editor and click 'Add conditional breakpoint' then enter a PowerShell expression in the text box that appears in the editor.
- Added a preview of a possible project template for PowerShell Gallery modules in
the
examplesfolder. Includes a PSake build script with Pester test, clean, build, and publish tasks. See theexamples\README.mdfile for instructions. Check it out and give your feedback on GitHub! using 'module'now resolves relative paths correctly, removing a syntax error that previously appeared when relative paths were used- Calling
Read-Host -AsSecureStringorGet-Credentialfrom the console now shows an appropriate "not supported" error message instead of crashing the language service. Support for these commands will be added in a later release.
powershell.useX86Host: If true, causes the 32-bit language service to be used on 64-bit Windows. On 32-bit Windows this setting has no effect.
- Updated PSScriptAnalyzer 1.4.0 for improved rule marker extents
- Added example Pester task for running tests in the examples folder
- Fixed #94: Scripts fail to launch in the debugger if the working directory path contains spaces
@rkeithhill spent a lot of time polishing the script debugging experience for this release:
- You can now pass arguments to scripts in the debugger with the
argsparameter in launch.json - You can also run your script with the 32-bit debugger by changing the
typeparameter in launch.json to "PowerShell x86" (also thanks to @adamdriscoll!) - The new default PowerShell debugger configuration now launches the active file in the editor
- You can also set the working directory where the script is run by setting the
cwdparameter in launch.json to an absolute path. If you need a workspace relative path, use ${workspaceRoot} to create an absolute path e.g."${workspaceRoot}/modules/foo.psm1".
We recommend deleting any existing launch.json file you're using so that a new one will
be generated with the new defaults.
-
Improved PowerShell console output formatting and performance
- The console prompt is now displayed after a command is executed
- Command execution errors are now displayed correctly in more cases
- Console output now wraps at 120 characters instead of 80 characters
-
Added choice and input prompt support
- When executing code using the 'Run Selection' command, choice and input prompts appear as VS Code UI popups
- When executing code in the debugger, choice and input prompts appear in the Debug Console
- "Find/Install PowerShell modules from the gallery" (
Ctrl+K Ctrl+F): Enables you to find and install modules from the PowerShell Gallery (thanks @dfinke!) - "Open current file in PowerShell ISE" (
Ctrl+Shift+i): Opens the current file in the PowerShell ISE (thanks @janegilring!)
- Path auto-completion lists show just the current directory's contents instead of the full path (which had resulted in clipped text)
- Parameter auto-completion lists are now sorted in the same order as they are in PowerShell ISE where command-specific parameters preceed the common parameters
- Parameter auto-completion lists show the parameter type
- Command auto-completion lists show the resolved command for aliases and the path for executables
- Many improvements to the PowerShell snippets, more clearly separating functional and example snippets (all of the latter are prefixed with
ex-) - Added some additional example script files in the
examplesfolder
powershell.developer.editorServicesLogLevel: configures the logging verbosity for PowerShell Editor Services. The default log level will now write less logs, improving overall performance
- Fix issue #49, Debug Console does not receive script output
- Major improvements in variables retrieved from the debugging service:
- Global and script scope variables are now accessible
- New "Auto" scope which shows only the variables defined within the current scope
- Greatly improved representation of variable values, especially for dictionaries and objects that implement the ToString() method
- Added new "Expand Alias" command which resolves command aliases used in a file or selection and updates the source text with the resolved command names
- Reduced default Script Analyzer rules to a minimal list
- Fixed a wide array of completion text replacement bugs
- Improved extension upgrade experience
- (Experimental) Added a new "Run selection" (F8) command which executes the current code selection and displays the output
- Added a new online help command! Press Ctrl+F1 to get help for the symbol under the cursor.
- Enabled PowerShell language features for untitled and in-memory (e.g. in Git diff viewer) PowerShell files
- Added
powershell.scriptAnalysis.enableconfiguration variable to allow disabling script analysis for performance (issue #11) - Fixed issue where user's custom PowerShell snippets did not show up
- Fixed high CPU usage when completing or hovering over an application path
Initial release with the following features:
- Syntax highlighting
- Code snippets
- IntelliSense for cmdlets and more
- Rule-based analysis provided by PowerShell Script Analyzer
- Go to Definition of cmdlets and variables
- Find References of cmdlets and variables
- Document and workspace symbol discovery
- Local script debugging and basic interactive console support