The SEAT package provides sklearn style API for structure entropy based hierarchy detection and embedding.
If you want to use the GPU to train the hierarchical embedding, please install the GPU version of PyTorch (https://pytorch.org/) in advance.
pip install pyseatThis example shows the usage of pyseat.SEAT. The functionality of pyseat.SEAT is the same as sklearn.cluster except pyseat.SEAT automatically tunes the best cluster number k (auto-k mode) associated with the minimal structural entropy in the structure entropy hierarchy. It also works for a predefined cluster number k (predefined-k mode).
from sklearn.neighbors import kneighbors_graph
import numpy as np
import seaborn as sns
from sklearn import datasets
from matplotlib import pyplot as plt
from pyseat.SEAT import SEAT
X, labels = datasets.make_blobs(n_samples=1000, random_state=8)
seat = SEAT(affinity="gaussian_kernel",
sparsification="knn_neighbors",
objective="SE",
strategy="bottom_up")
seat.fit_predict(X)
# seat output
print('--------------------------')
print('The best k is:', seat.optimal_k)
print('SEAT optimal clustering result: \n', seat.labels_)
print('Candidate k for tuning: \n', seat.ks)
print('SE score for tuning k: \n', seat.se_scores)
print('SEAT clustering result for different k: \n', seat.ks_clusters)
print('SEAT club labels: \n', seat.clubs)
print('SEAT orders: \n', seat.order)
print('SEAT order in oval plot: \n', seat.oval_embedding)
print('SEAT hierarchy in newick format: \n', seat.newick)
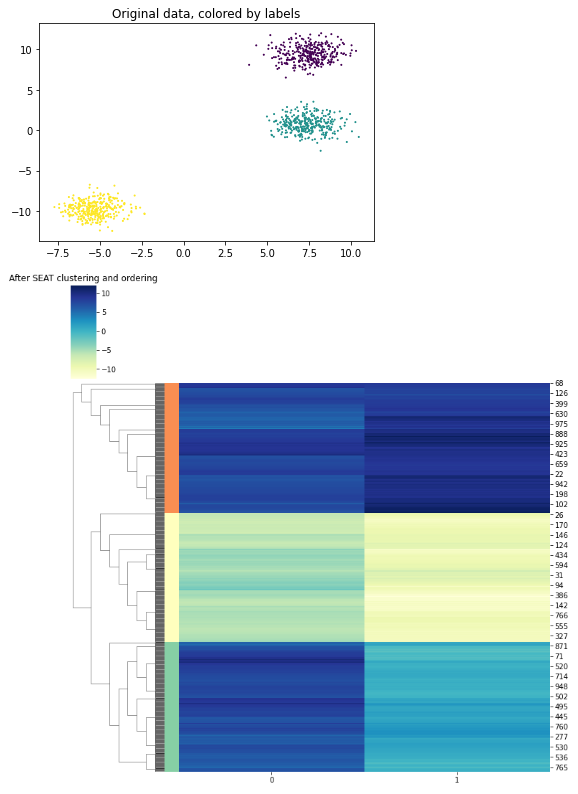
plt.title('Original data, colored by labels')
plt.scatter(X[:, 0], X[:, 1], s=1, c=labels)
plt.show()
oval_embed = seat.oval_embedding()
plt.title('Oval plot, colored by labels')
plt.scatter(oval_embed[:, 0], oval_embed[:, 1], s=1, c=labels)
plt.show()
# plot the structure entropy hierarchy and clustering result
label = seat.labels_
label_colors = dict(zip(set(label), sns.color_palette('Spectral', len(set(label)))))
label_colors = [label_colors[l] for l in label]
sns.clustermap(X,
row_linkage=seat.Z_,
col_cluster=False,
row_colors=label_colors,
cmap='YlGnBu')
plt.title("After SEAT clustering and ordering")
plt.show()Outputs:
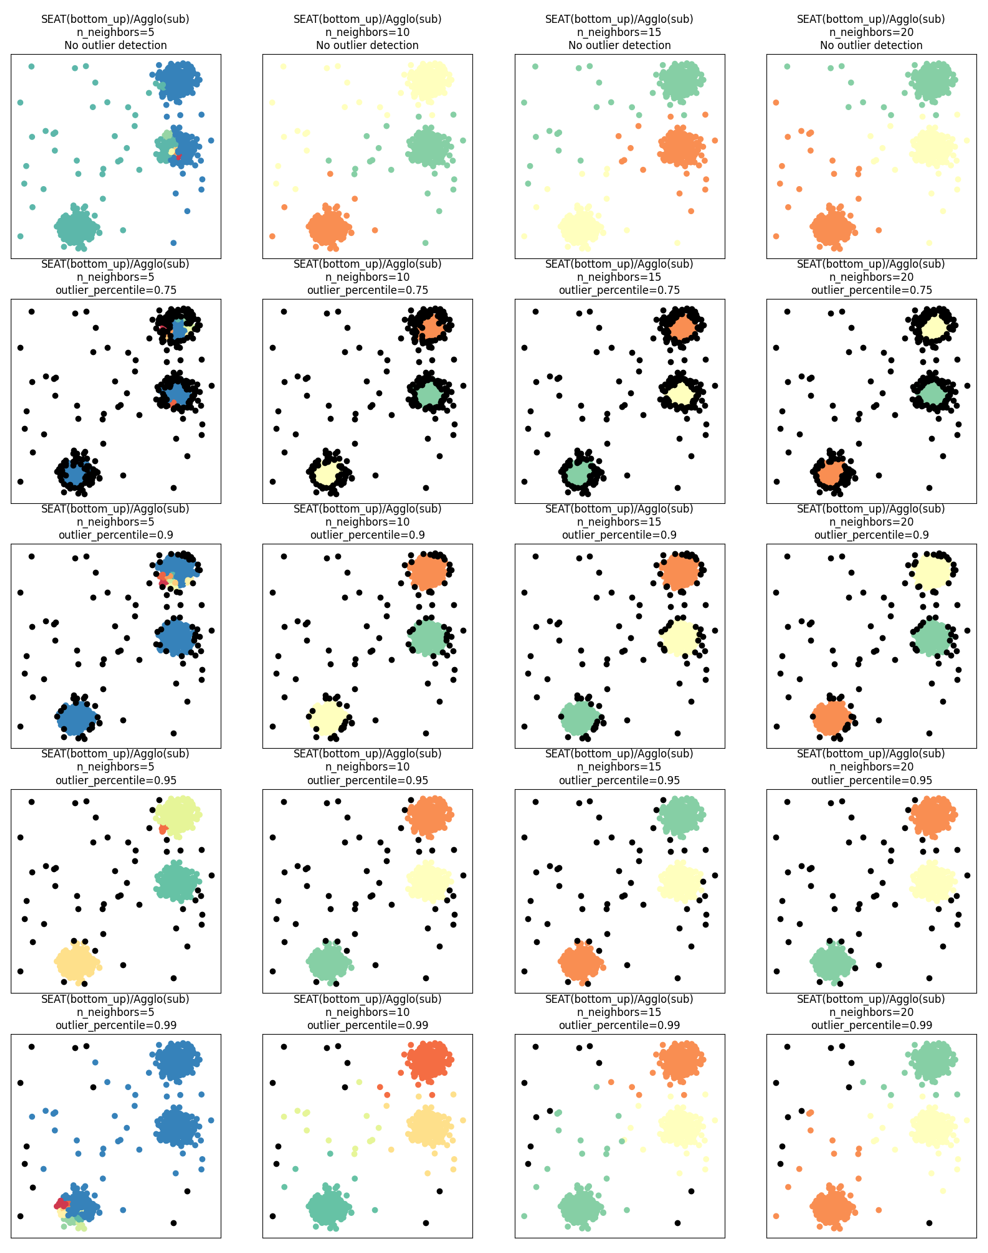
SEAT supports kNN outlier detection by setting outlier_detection = knn_neighbors. The outliers are assigned to label -1. The associated hyperparameter outlier_percentile defines that data points with average knn distance exceeding a specific percentile (default: 0.95) are considered as outliers. run_outlier_toy.ipynb compared the clustering performance with and without outlier detection with varying n_neighbors and outlier_percentile combinations. Here, the detected outliers are colored with black.
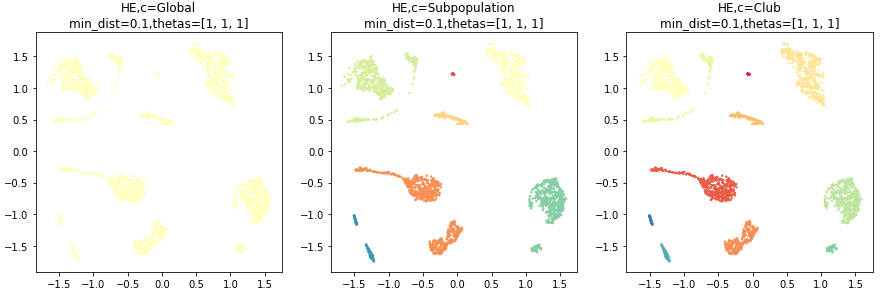
This example shows the usage of pyseat.HierachicalEmbedding.
import pandas as pd
from pyseat.HierachicalEmbedding import HierachicalEmbedding

y = pd.DataFrame({
    'Global': [1]*len(seat.labels_),
    'Subpopulation': seat.labels_,
    'Club': seat.clubs
})

HE = HierachicalEmbedding(device='cpu', n_epochs=200, init='random', random_state=0,
                          min_dist=0.1,
                          n_components=2)

embed = HE.fit_transform(seat.aff_m, y, thetas=[1, 1, 1])
print('SEAT hierachical embedding: ', embed.shape)
HE.viz_fit()
Outputs:

Cells possess functional diversity hierarchically. However, most single-cell analyses renounce the nested structures while detecting and visualizing the functional diversity. We have incorporated cell hierarchy from SEAT to study functional diversity of single cells at subpopulation, club (i.e., sub-subpopulation), and cell layers [1].

run_demo_p3cl.ipynb shows the usage of SEAT in detecting the cell subpopulations and clubs, and visualizing the nested structure of cells on scRNA p3cl dataset.

clustering_comparison.ipynb shows characteristics of SEAT against different auto-k and predefined-k clustering algorithms on toy datasets that are "interesting" but still in 2D. Except for the last dataset, the parameters of each of these dataset-algorithm pairs have been tuned to produce good clustering results.
SEAT against auto-k clustering tools:

SEAT against predefined-k clustering tools:

Parameters:
min_k: The minimal number of clusters for searching. Default: 2.max_k: The maximal number of clusters for searching. Default: 10 or the number of submodules in the tree.affinity: Method used to compute the dense similarity graph. Currently, "precomputed", "gaussian_kernel", "linear_kernel", "cosine_similarity", "knn_neighbors_from_X", and "laplacian_kernel" are available. If "precomputed", a similarity matrix is needed as input for the fit method. Default: gaussian_kernel.kernel_gamma: Thegammahyperparameter for kernel-based affinity function if applicable. Default: the standard deviation of inputX.sparsification: Method used to construct the sparse similarity graph. Currently, "affinity", "precomputed", "knn_neighbors", "knn_neighbors_from_X" are available. "affinity" means the sparse graph is the same as the dense graph. If "precomputed", a similarity matrix is needed as input for the fit method. "knn_neighbors" means the sparse graph is constructed from the dense graph use kNN sparsification. "knn_neighbors_from_X" means the sparse graph is constructed from input dataXwith kNN. Default: knn_neighbors.n_neighbors: The number of neighbors used in kNN if applicable. Default: 10.objective: The metric to measure the global uncertainty of a graph. Default: SE.strategy: The hierarchy building strategy, "bottom_up" or "top_down". Default: bottom_up.outlier_detection: The outlier detection strategy, "knn_neighbors" or "None". Default: None.outlier_percentile: The data points with average knn distance exceeding a specific percentile (default: 0.95) are considered as outliers. Default: 0.95.verbose: SEAT will output calculation information if verbose is True.
Methods:
fit(X): FitXfor structure entropy hierahcy detection from features, or distance matrix.
X: array, shape (n_samples, n_features) or (n_samples, n_samples). If the metric is "precomputed",Xmust be a square distance matrix. Otherwise, it contains a sample per row.
fit_predict(X): FitXfor structure entropy hierarchy detection from features or distance matrix, and return the auto-k clustering assignment.
X: array, shape (n_samples, n_features) or (n_samples, n_samples). If the metric is "precomputed",Xmust be a square distance matrix. Otherwise, it contains a sample per row.
Attributes:
optimal_k: The best cluster numberkassociated with the minimal structural entropy in the structure entropy hierarchy.labels_: Cluster labels for theoptimal_k.Z_: The linkage matrix used to plot the hierarchy dendrogram.ks: The list of candidatekfor tuning.se_scores: The structure entropy score for eachk.ks_clusters: The clustering result for eachk.clubs: The clustering result at the club level.order: The datapoint 1D order from the obtained hierarchy.
Parameters:
affinity: Method used to compute the dense similarity graph. Currently, "precomputed" is available. Please input the dense graph fromseat.aff_mfor the fit method.init: The method of initialization. Currently, "spectral" and "random" are available.device: "cpu" or "gpu" for training. Default: "cpu".n_epochs: The number of epochs for training. Default: when the number of datapoints is no less than 10000, n_epochs are 1000 and 500 for spectral and random initialization; when the number of datapoints is larger than 10000, n_epochs are 600 and 200 for spectral and random initialization.learning_rate: The learning rate for training. Default: 1e-2.random_state: The metric to measure the global uncertainty of a graph. Default: None.min_dist: Hyperparameter controls how tightly to pack points together. Default: 0.1.spread: Hyperparameter controls how tightly to pack points together. Default: 1.
Methods:
fit_transform(X, y, thetas=[0.0, 0.2, 0.8]): FitXinto an embedded space and return that transformed output.
X: array, shape (n_samples, n_samples).X = seat.aff_m.y: array or dataframe, shape (n_samples, n_labels). Different resolutions of target labels for supervised hierarchical embedding.thetas: list, shape(n_labels). The training weight for different label resolutions.
Attributes:
viz_fit(n_row=3, n_col=None, fig_width=5, fn=None): The visualization of the training process.
n_row: integer. The number of rows for subplots.n_col: integer. The number of columns for subplots.fig_width: integer. The figure width.fn: file path. The file path to save the visualization.
If you are using SEAT in your project, please cite:
[1] Chen, Lingxi, and Li, Shuai Cheng. "Incorporating cell hierarchy to decipher the functional diversity of single cells." Nucleic Acids Research (2022). https://doi.org/10.1093/nar/gkac1044
@article{chen2022incorporating,
    author = {Chen, Lingxi and Li, Shuai Cheng},
    title = "{Incorporating cell hierarchy to decipher the functional diversity of single cells}",
    journal = {Nucleic Acids Research},
    year = {2022},
    month = {11},
    issn = {0305-1048},
    doi = {10.1093/nar/gkac1044},
    url = {https://doi.org/10.1093/nar/gkac1044},
    note = {gkac1044},
}v0.0.1.3: released on 2022/10/08, add outlier detection.v0.0.1.2: released on 2022/04/20, the manuscript version.v0.0.1.1: released on 2021/10/07, the initial version.