This document contains details of the work done and the code contributions made as a part of the GSoC 2020 program.
Added LidarVisual implementation for Ogre1, empty classes for Ogre2 #103
Add types for lidar visual #114
Ogre2 Implementation for Lidar Visual #116
Add LidarVisual point colors for Ogre1 #124
Visualize Lidar Plugin for ign-gazebo #301
Adding option for visibility #133
minor change in LidarVisual for the case when sensor data is more than sensor range #132
FIX failing lidar visual integration test #121
Create lidar visualization #84
DARPA SubT Team CERBERUS Robot Model - Gagarin Sensor Configuration 1

I am an incoming student into the Ph.D. in Computer Science program at the University Of Nevada, Reno. I graduated from Birla Institute of Technology and Science (BITS) Pilani, India in 2020, with a degree in Mechanical Engineering.
I have been involved in robotics-related projects for over three years. I have learned a lot during this time, and ROS and Gazebo have played a major role during the journey.
I completed my Bachelor's Thesis at the Autonomous Robots Lab, University of Nevada, Reno, where I worked on the motion planning for a reconfigurable aerial robotic system. My results were implemented using ROS and Gazebo and have now been published in a major conference. Through the lab, I am also a part of Team CERBERUS, participating in the DARPA Subterranean Challenge, focusing on autonomous search and rescue missions.
During the GSoC program, I worked on porting the lidar visualization from Gazebo to the ign-rendering library and creating a GUI plugin for the user to control it. This plugin adds to the visualization capabilities of the IgnitionRobotics project. It allows the user to better understand the sensor data through customizable visuals.
Project - Sensor Data Visualisation (Open Robotics)
This project is a part of a larger Ignition simulation framework, which aims to provide a new simulation platform for roboticists. This project is a successor of the Gazebo Simulator. This new simulation framework contains improvements and a redesign of the backbone of the simulation framework that exists in Gazebo. It supports distributed simulation, dynamic asset loading, and tunable performance. It also provides cross-platform support on Linux, macOS, and Windows, hence making simulation more accessible to all.
The simulation is being made more realistic, making use of advanced 3D graphics software Ogre 2.1. The implementation of graphics is done through the Ignition Rendering library, which provides access to the latest rendering techniques and a faster rendering pipeline.
During my GSoC, I worked directly on the ignition-rendering library to add sensor data visualization.
The task of the project is to create visualizations for lidar data in the ignition-rendering library and to load it as an interactive plugin in the simulation environment.
This issue created by my mentor highlights my tasks for the GSoC.
Create visualizations for lidar data. This can be divided into smaller subtasks:
- Design public APIs for a lidar visualization class, e.g., LidarVisual. The abstract interface will go in ign-rendering/include/ignition/rendering/ and a base implementation will live in ign-rendering/include/ignition/rendering/base
- Port the LaserVisual class from Gazebo to ign-rendering/ogre. This would be the ogre 1.x implementation. Note that in Gazebo's LaserVisual class, the data come from ign-transport. However, since ign-rendering does not use ign-transport, we should design the APIs in 1. to support accepting and modifying lidar data, e.g., either an API that takes a vector of floating-point values or individual values. We will call these APIs from ign-gazebo to feed it the lidar data to be visualized.
- Add ogre 2.x implementation
This work was a part of the GazeboSim project. It was implemented in Gazebo as a visual and widely used within the robotics community. This work was to be ported to ign-rendering and made compatible with the new rendering framework, compatible with both Ogre1 and Ogre2.


The implementation of the LaserVisual in Gazebo-Classic can be found here
The initial part of the work involved going through the code in the gazebo repository. Since this was my first introduction to any rendering engine, it took some time to understand how the engine, scene, visuals, geometries, and nodes are linked to one another and what purpose they serve in the rendering pipeline.
Initially, it was not very clear, but searching through the repository for examples and various implementations allowed me to get a good idea of the same. Since Gazebo classic's implementation is almost identical to the Ogre1 implementation in ign-rendering, it was easy to port a similar code to ign-rendering and test it. By the end of my first month of GSoC, I put together a basic example of the lidar visual. I opened a Pull Request to the ign-gazebo repository. You can view my Pull Request here :- Added LidarVisual implementation for Ogre1, empty classes for Ogre2 #103
During this submission, I found out the importance of writing maintainable code. My mentors pointed out possible improvements to readability and optimizations for faster operation. My code was tested on the organization's build farm on different operating systems to ensure that the code compiles and is free of errors. This process is undoubtedly necessary. It is not always possible for me to test the same code on multiple operating systems locally due to hardware constraints.
 The image above shows an initial LidarVisual in ign-rendering with dummy sensor data.
I noticed that the entire field-of-view of the sensor was being shown by the visual using blue colored strips in the previous implementation. This has been implemented in numerous robots in Gazebo. For robots that had very dense rays from the sensors, this caused significant difficulty for the user to visualize the relevant rays from the lidar sensor, which were only slightly darker.
A new feature was added to the visual where the user can select whether they want to see only the rays hitting a particular obstacle. This means that the programmer or the developer can visually see the lidar sensor's relevant features and avoid the clutter caused by the lidar data that is of no use to the robot. This would significantly help in debugging the robot's behavior if the developer can see what the robot sees instead of having to deal with raw numbers.
Another addition made was providing the user an option to visualize the sensor data as either ray lines or points. This addition helped avoid the clutter caused due to large blue triangles on the screen. It made it easier to customize the visual as per the user's preferences.
This feature was submitted as a part of this Pull Request:- Add types for lidar visual #114


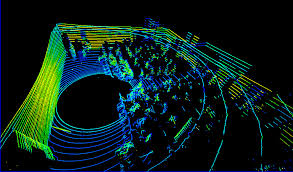
In the above image, the sensor data can be seen visualized as points. This is similar to how a point cloud is also seen during simulations. This will form a basis for creating the point cloud visualization class later.


The above image shows the visual as ray lines. This is significantly faster to render, and less cluttered than the triangle strips visual shown above.
Post the implementation of the visual in Ogre1. The task was to implement the same in Ogre2. It boasts of improved performance, a faster scene manager, in addition to more realistic rendering. Some performance metrics between Ogre1 & Ogre2 can be seen here.
An addition to the API was made to allow the user to clear all the visual data at will.
This Pull Request adds LidarVisual implementation to Ogre2:- Ogre2 Implementation for Lidar Visual #116


The visuals have been implemented in Ogre2, as shown above.
Once the points were implemented, it was noticed that the size of the points showing the lidar data reading remains constant. On zooming into the scene, the point size does not change despite the size of all other objects changing as per the camera's location. This caused difficulties in viewing the points.
Additionally, the points rendered by in the scene did not show independent color. This was an issue as coloring the points gives the user more information about the location, intensity, or reflectivity of the obstacle, as seen by the sensor. This coloring of points is necessary for many robotic applications. The below images shows the importance of point coloring in robotic applications.
The point colors help rudimentarily segment the part of the environment.
We created a material that is displayed as a flat square facing the user's camera to add this capability. This material allows the user to change the color of every point. This material can be used further when the point cloud is implemented.
The Pull Request can be seen here:- Add LidarVisual point colors for Ogre1 #124
After this implementation was done, it was time to integrate the LidarVisual from the ign-rendering library into the ign-gazebo simulator.
The Pull Request can be tracked here:- Visualize Lidar Plugin for ign-gazebo #301
An interface has been created using the Qt framework. Options are provided to:-
- Turn the visual ON/OFF.
- Select the message topic to visualize.
- Select type of lidar visual between Points, Rays, and Triangle Strips.
- Display sensor properties in the plugin window.
- Choose to display only the sensor rays that are hitting an obstacle.
The brief guide on the GUI can be seen here:-

The above plugin GUI was implemented using Qt and C++.
An example of the code in action in an ign-gazebo environment is seen here.
The world in the examples consists of a Playground Model from the Ignition Fuel Server.
There is a stationary lidar sensor with the following sensor properties. The information is entered in SDFormat. For more information about this, please visit sdformat.org.
<sensor name='gpu_lidar' type='gpu_lidar'>
	<topic>lidar</topic>
	<update_rate>10</update_rate>
	<lidar>
	<scan>
		<horizontal>
		<samples>640</samples>
		<resolution>1</resolution>
		<min_angle>-1.396263</min_angle>
		<max_angle>1.396263</max_angle>
		</horizontal>
		<vertical>
		<samples>16</samples>
		<resolution>1</resolution>
		<min_angle>-0.261799</min_angle>
		<max_angle>0.261799</max_angle>
		</vertical>
	</scan>
	<range>
		<min>0.08</min>
		<max>10.0</max>
		<resolution>0.01</resolution>
	</range>
	</lidar>
	<alwaysOn>1</alwaysOn>
	<visualize>true</visualize>
</sensor>
There is another lidar modeled after the Hokoyu lidar sensor referenced from Gazebo. This mobile base is a diff-drive platform used for the validation of various applications in ign-gazebo.
The sensor properties of the second lidar are:-
<sensor name='gpu_lidar' type='gpu_lidar'>
	<pose>0 0 0 0 0 0</pose>
	<topic>lidar2</topic>
	<update_rate>10</update_rate>
	<lidar>
	<scan>
		<horizontal>
		<samples>160</samples>
		<resolution>1</resolution>
		<min_angle>-1.396263</min_angle>
		<max_angle>1.396263</max_angle>
		</horizontal>
		<vertical>
		<samples>1</samples>
		<resolution>1</resolution>
		<min_angle>0.0</min_angle>
		<max_angle>0.0</max_angle>
		</vertical>
	</scan>
	<range>
		<min>0.08</min>
		<max>10.0</max>
		<resolution>0.01</resolution>
	</range>
	<noise>
		<type>gaussian</type>
		<mean>0</mean>
		<stddev>0.1</stddev>
	</noise>
	</lidar>
	<alwaysOn>1</alwaysOn>
	<visualize>true</visualize>
</sensor>
For the second sensor, the noise has been added to approximate real-world behavior.
The following example shows how the visual is seen when the stationary sensor's data is read and visualized as points.

The option to visualize the points that are hitting the obstacles helps the user better make sense of the lidar data.
In the following media attachment, an example is shown where the sensor data from the mobile robot is read and visualized. Here, the different visuals are seen, and the importance of this to the user is realized.

Finally, a practical application of the robot moving is shown. In this application, the visual must be consistent and update correctly when the robot is in motion.

With the above work, the GSoC project is concluded.
I thank my mentors Ian Chen, Alejandro Hernández Cordero, for their constant support and guidance. I have learned a lot during the GSoC program under their guidance.
I want to thank Open Robotics for being a fantastic GSoC host organization. The organization included the interns in their weekly team meetings. It gave us an opportunity to observe and be a part of the larger Ignition project. The meetings gave the students insight into how large teams are working together on big projects and how smoothly the work is being done despite the constraints of the ongoing pandemic.
With this program's conclusion, I am confident that I have learned many necessary skills and will continue to contribute to open source repositories and try my best to give back to the robotics community.